
You’re feeling good. You’ve been logging consistent miles, your pace is getting better, and the finish goal of your next race is now in reach. But then, BAM! Your body throws a curveball: a nagging pain, fatigue that won’t quit, or a sudden drop in motivation. Does this sound familiar?
The culprit? Not managing your training load.
Think of our bodies like a high-performance engine. One can’t just slam the accelerator and expect it to run faster forever. One needs a strategic approach to build power and endurance without blowing the engine.
It’s not just about the miles we run every week; it’s about the quality of your training, the intensity you push, and the recovery you allow your body. Sure, weekly mileage is a good starting point, but it’s like looking at a car’s odometer and assuming that’s all you need to know about its performance. One should consider these factors when understanding their Training Load:
Training load or Exercise Load is a metric that refers to the amount of stress you put on your body during training. Different devices and apps estimate the training load differently. Hence it is important not to compare them across the devices, but use the trend.
For example, Garmin estimates the training load based on the concept of Excess Post-exercise Oxygen Consumption (EPOC). EPOC reflects the metabolic cost of the activity and the energy required for recovery. Where in Strava estimates using Impulse Response Model which uses heart rate and duration. Here are different devices and apps, and the metrics they use to indicate training load estimates.
| Device/App | Metric Used |
| Garmin | Exercise Load |
| Training Peaks | Training Stress Score (TSS) |
| Coros | Training Load (TL) |
| Strava | Relative Effort |
Why is it Important?
Training Load is an estimated metric, hence an absolute value has no meaningful interpretation. What matters is the trend of this metric.
Your training load is a delicate balance. You need to push yourself (build ATL), but also ensure your body has enough time to recover (CTL).
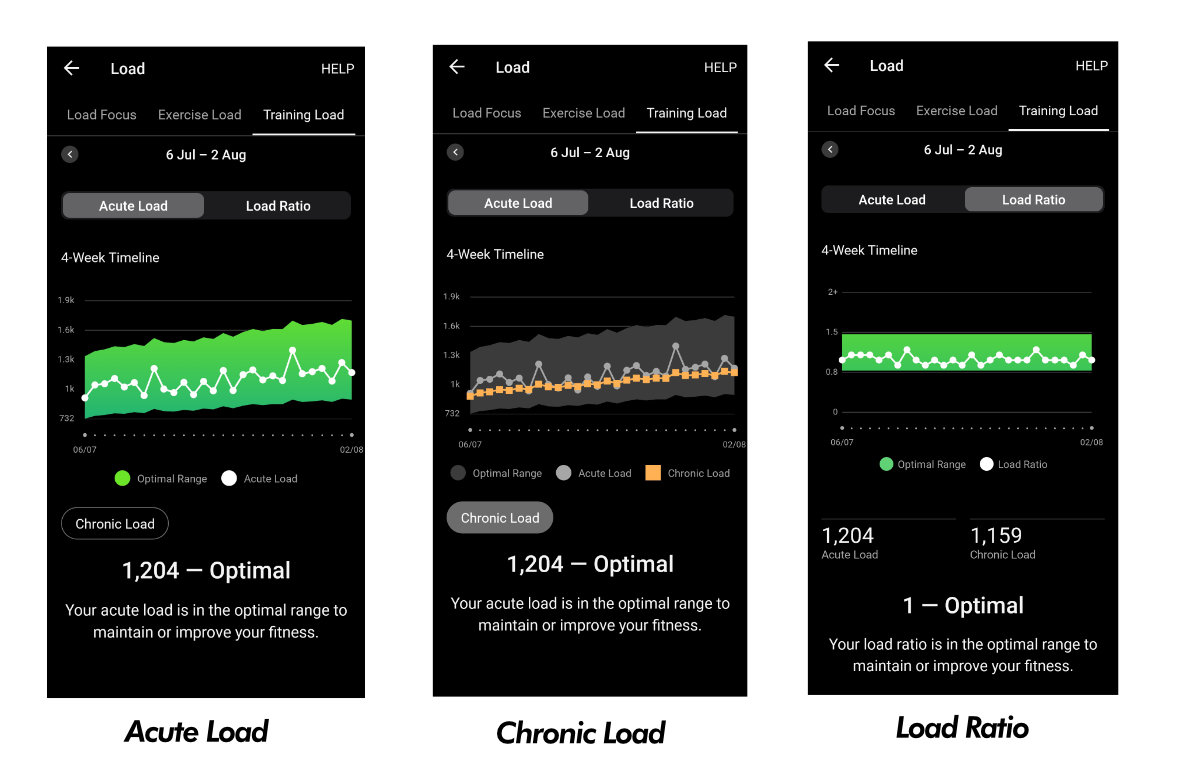
Most of the modern Garmin watches, offer “Exercise Load” for every run activity. This is primary metric that indicates the training load. Apart from it, Garmin offers 3 more trend metrics to understand the training load trend - Acute Load (AL), Chronic Load(CL) and Load Ratio. AL represents the short-term load you’ve been putting on your body over a week. CL represents the long-term load, indicating your fitness level based on the past 4 weeks. Load Ratio (LR) is the ratio of your acute (short-term) training load to your chronic (long-term) training load. It’s helpful for tracking your training load changes.
Once run data is synced, you can view training load metrics in the Garmin Connect app:
Load Ratio is a good start point to analyze your training load. Garmin shows Load Ratio and also a status to interpret the same. The following table shows the Load Ratio and its interpretation.
| Load Ratio Value | Status | Description | Action |
| None | No Status | Load ratio will be visible after 2 weeks of training. | Ensure all workouts are recorded and synced to build accurate training data. |
| Lower than 0.8 | Low | Your short-term training load is lower than your long-term training load. | Increase the intensity or volume of workouts to continue improving fitness. |
| 0.8 to 1.4 | Optimal (Green) | The short-term and long-term training loads are balanced. The optimal range is based on your individual fitness level and training history. | Maintain current training regimen with increase in ATL and gradual increase CTL to ensure continuous improvement. |
| 1.5 to 1.9 | High | Your short-term training load is higher than your long-term training load. | Plan recovery periods and reduce the intensity or volume of workouts to prevent overtraining. |
| 2.0 or higher | Very High | Your short-term training load is significantly higher than your long-term training load. | Immediately reduce training load and prioritize rest and recovery to avoid potential setbacks. |
At the end of each week, review your AL, CL, Load Ratio scores. Identify patterns and trends in your training load and performance.
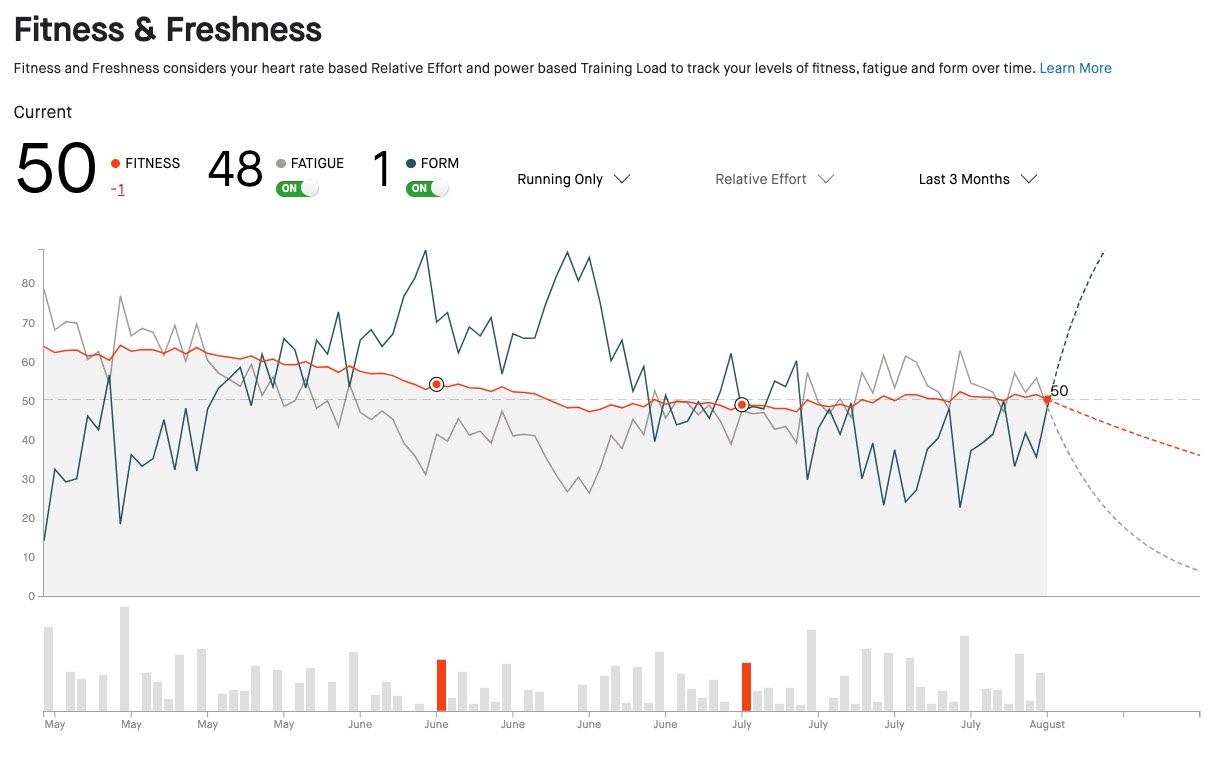
Strava uses a different set of metrics that indicates Training Load trends. Relative Effort is the basic strava metric that estimates Trainig Load. Apart from it, Strava calculates 3 scores - Fitness, Fatigue, and Form.
Adjusting Training Based on Strava Metrics
| Fitness | Fatigue | Indicated Training Adjustment |
| Low | Incorporate more base training and reduce high-intensity sessions. | |
| High | Plan for recovery or tapering periods to avoid overtraining and optimize performance. | |
| Balanced | Continue current training regimen with slight variations to maintain progress and prevent stagnation. |
Remember that Training load is a valuable tool, not a rigid rule. It’s about understanding your body’s signals, respecting its needs, and building a training plan that empowers you to reach your goals.

Aravind is a technologist, marathoner, and self-confessed running shoe geek. He’s passionate about the intersection of technology and running, with a keen interest in running mechanics. Aravind is also the co-founder of GeeksOnFeet, a platform dedicated to helping runners train smarter through data, technique, and community. Find him on Twitter: @imgeeksonfeet