
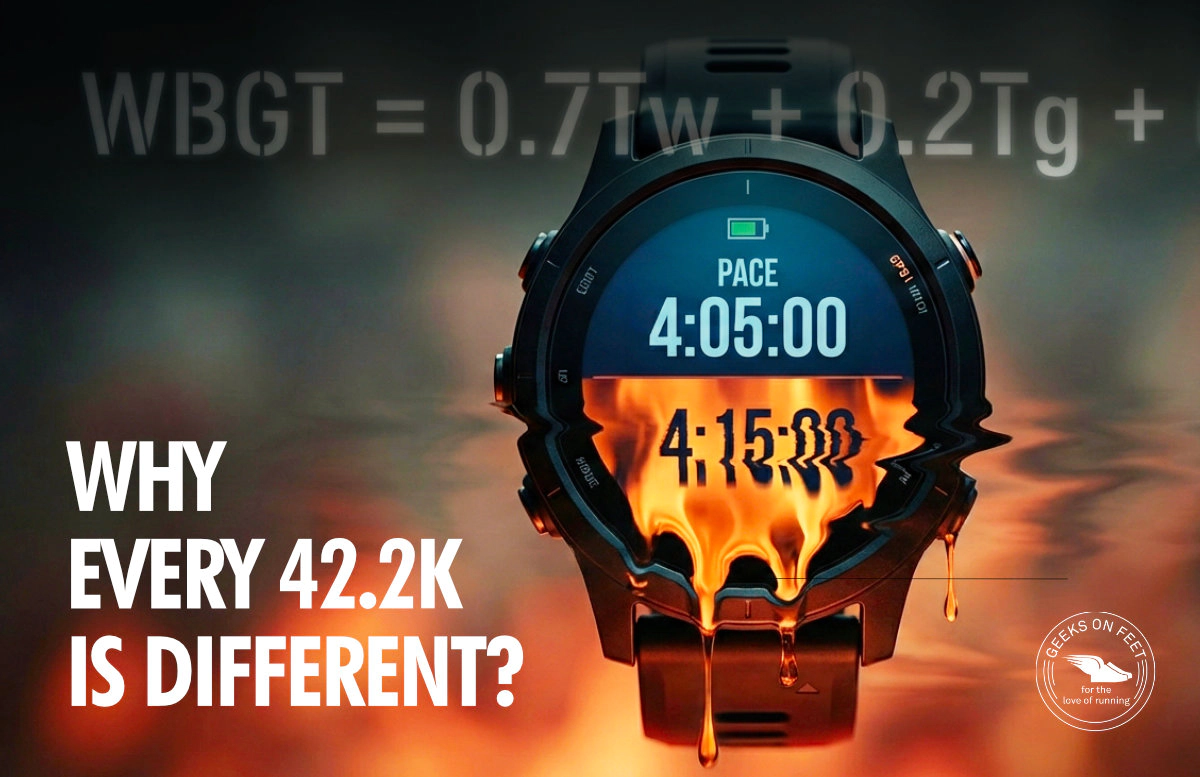
You ran the Mumbai Marathon in January and finished in 4:15:00. Four weeks later, you ran the New Delhi Marathon in February and crossed the line at 4:05:00; a full 10 minutes faster.
Did your fitness dramatically spike in just one month? Not exactly. You didn’t suddenly become a 10-minute faster runner; you simply ran in a fundamentally different physiological environment.
Comparing race times across Indian cities—or even across seasons within the same city—is largely meaningless without accounting for three variables that most runners overlook: heat stress, altitude, and course grade. This article explains why conditions dictate your time just as much as your fitness, and introduces a calculator that does the math for you.
Race times project a false sense of absolute objectivity. A 4:05 is faster than a 4:15, which seems irrefutable on paper.
However, a finish time is not a pure measurement of fitness; it is a measurement of fitness plus conditions. A 4:15:00 marathon in Mumbai at 7:00 AM in January, when the Wet Bulb Globe Temperature (WBGT) sits around 16–18°C, represents a nearly identical physical output to a 4:05:00 marathon in Delhi in February, when the same metric hovers in the much cooler 10–14°C range.
The question that actually matters is: what would you have run in ideal conditions? That baseline number is the honest measure of your current fitness.
While most runners check the temperature, fewer track Wet Bulb Globe Temperature (WBGT), which is the standard metric used in sports medicine to measure heat stress.
WBGT combines three distinct readings:
The Formula: > WBGT = 0.7 × wet bulb + 0.2 × black globe + 0.1 × dry bulb
Because humidity holds a 70% weighting in this formula, Mumbai’s coastal air feels significantly more taxing than Delhi’s drier winter mornings. When humidity is high, your sweat does not evaporate efficiently. Consequently, your core temperature climbs faster for the same effort, and your heart redirects blood to your skin for cooling instead of to your working muscles.
WBGT Thresholds for Runners:
| WBGT | Zone | Physiological Impact |
|---|---|---|
| ≤ 10°C | Optimal | No adjustment needed. |
| 10–15°C | Initial degradation | A small pace reduction is prudent. |
| 15–21°C | Moderate strain | Heart rate rises noticeably for the same pace. |
| 21–28°C | High risk | Early pacing restraint is necessary for self-preservation. |
| > 28°C | Extreme risk | Standard pacing models break down entirely. |
The transition from Mumbai’s “moderate strain” zone to Delhi’s “initial degradation” zone is not a minor meteorological footnote. It is the exact reason a runner can drop 10 minutes off their marathon time in just four weeks without actually gaining fitness.
In 2007, researchers published a benchmark paper in Medicine & Science in Sports & Exercise analyzing marathon performance and heat. Their headline finding is crucial for recreational athletes: slower runners are penalized more by heat than faster ones.
The study analyzed decades of race results, tracking populations from elite winners down to 300th-place finishers as the WBGT climbed. The data showed a widening gap: a 25th-place finisher slowed by roughly 1.1% for every 5°C increase in WBGT. A 300th-place finisher, however, slowed by roughly 3.2% for that same temperature bump—nearly three times the penalty.
The researchers hypothesized this happens for two reasons: slower runners spend more time on the course accumulating heat stress, and they often run in dense packs, which drastically reduces the ambient air flow needed to cool the body.
India offers a diverse altitude distribution for runners. Coastal cities like Mumbai, Chennai, Kolkata, and Kochi sit at sea level. Moving inland, Delhi sits at 216m, Hyderabad at 505m, Pune at 560m, and Bengaluru at 920m.
Physiologically, there is a “dead band” below roughly 700m where altitude has minimal impact on aerobic performance. If you race between Hyderabad and Mumbai, altitude is not the variable altering your time.
However, two notable exceptions exist:
Completely flat race courses are rare. The cumulative elevation of a route affects your time in ways that a simple distance measurement ignores.
Metabolic cost models show that running uphill costs significantly more energy than running on flat ground. While downhill running recovers some of that cost, technical descents requiring braking can eliminate most of that recovery benefit. Two 10K races can have identical distances but drastically different grade loads, making direct time comparisons inaccurate.
In our calculator, Grade is modeled with a simplified Minetti slope-cost equation, using 3.6 as the flat-running baseline. Climb and descent are converted into average grade over the course, then translated into an energy-cost adjustment. Uphill raises cost nonlinearly, while downhill can reduce cost up to a point; to avoid overstating downhill advantage, the model caps net grade benefit at -8% and adds an extra braking penalty for technical descents.
This provides a practical race-level approximation of how elevation profile affects finish time without requiring full GPX segment-by-segment analysis.
1. Reverse Normalization: It takes your recent race time and strips out the environmental conditions (heat, altitude, and grade). This produces an estimate of what you would have run in ideal conditions (a WBGT of 10°C or below, at sea level, on a flat course). The result is your calibrated fitness baseline.
2. Forward Projection: It takes that ideal baseline and applies the expected conditions of your target race (historical weather, venue altitude, and course profile). The output is an accurate prediction of what those specific conditions will do to your finish time.
(Note: The calculator pulls four-year historical averages from Open-Meteo to provide a reliable planning estimate for your race day).
Imagine you ran the Mumbai Marathon in January in 4:15:00 with a WBGT of 18°C.
If you had planned to run a 4:15 simply because you “ran 4:15 in Mumbai,” the altitude would have dismantled your pacing strategy within the first 5 kilometers.
No model is perfect, and this calculator takes necessary liberties to be useful for the average runner:
Most race prediction tools are built using data from temperate European or North American climates, where environmental variance is relatively low.
The Indian running calendar spans from a crisp 6°C WBGT in Himalays to a punishing 28°C WBGT in a southern coastal city. Stark difference between optimal performance conditions and a physiological red zone. By contextualizing your performances, you can set realistic race-day goals and properly validate your training efforts.
Calculate your normalized baseline and project your next race at runstrong.geeksonfeet.com/race-finish-time-calculator.
This article is compiled by Team GeeksOnFeet for the love of running. If you have any questions or suggestions, feel free to reach out to us at [email protected].