
The TCS World 10K Bengaluru, continues to solidify its reputation as one of the world’s premier 10-kilometre road races. With its World Athletics Gold Label status, this year’s event saw Joshua Cheptegai winning the race.
The 2025 edition of Open 10K saw record growth in participation, with more than 16,000 runners finishing in the open category, which is the highest so far for the event. The challenging course, testing weather conditions, keeps the runners on the toes.
As with our tradition at GeeksOnFeet, we have crunched the timing data of all the Open 10K finishers. Here are some of the insights, that we thought are interesting for everyone.
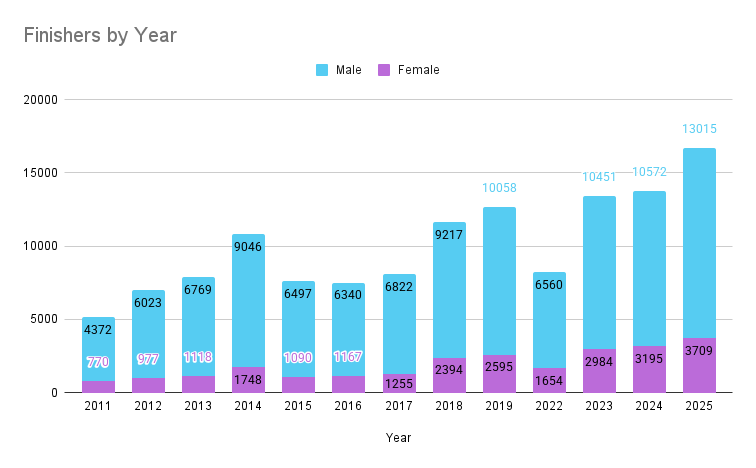
2025 recorded the highest number of finishers over the years.
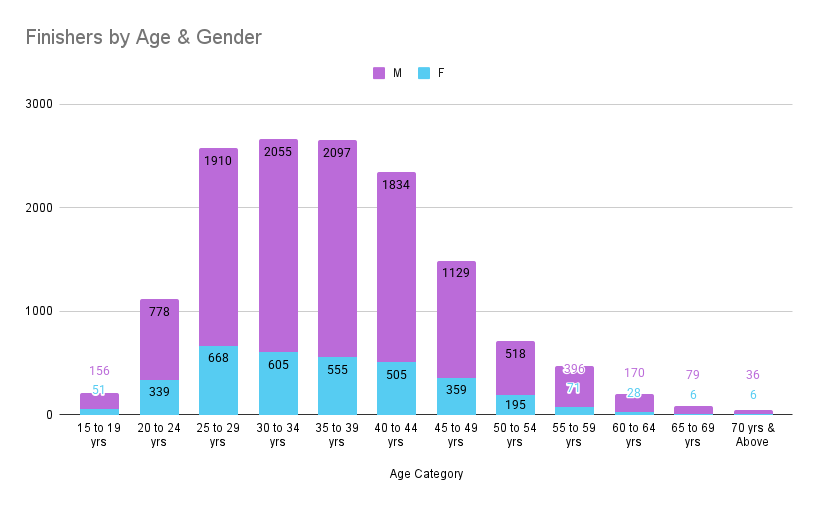
Youth Participation (15 to 19 & 20 to 24) is the lowest, with only 1300+ finishers combined.
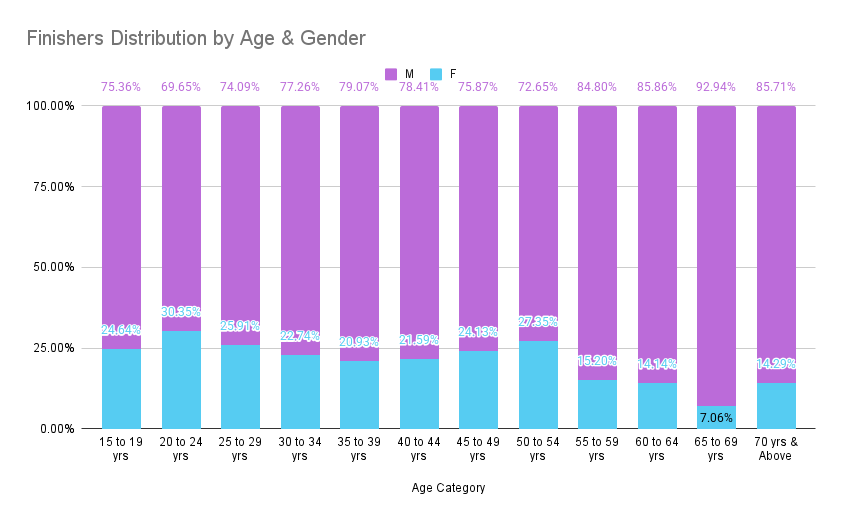
What is interesting is the age group category 20-24 has 30% female, the highest among the age groups. Distribution however drops more steeply among women post-55.
30 to 34 years is the largest group with 2660+ finishers. TCS World 10K has always been popular among 30-34 years category. This followed closely by age groups 35–39 and 25–29.
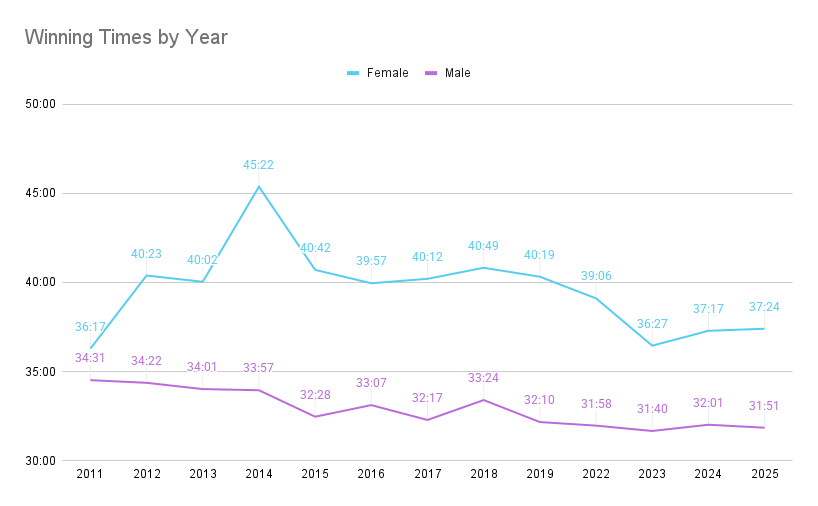
Analysis of the winning times for female and male winners in the TCS World 10K Bengaluru from 2011 to 2025, show both female and male finish times have improved over the years.
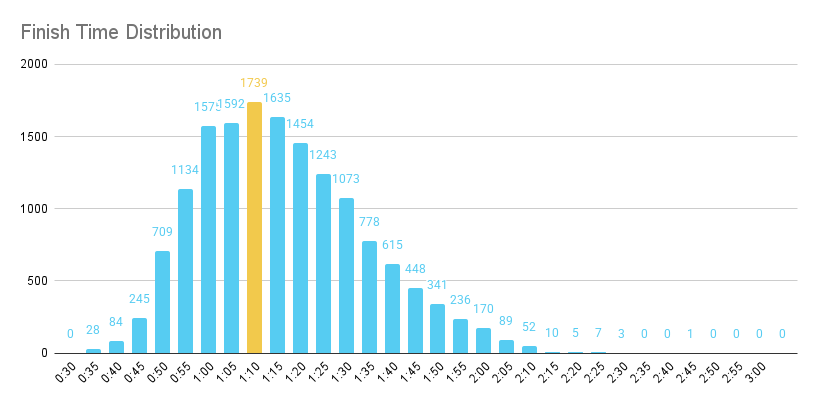
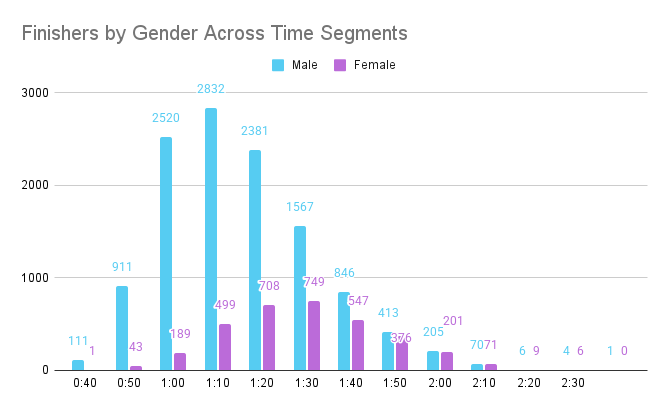
The distribution forms a classic bell curve centered between 55 and 75 minutes. Most common finishing time lies in the 1:05 to 1:10 range — nearly 11% of all runners finished here. This indicates that for the average recreational runner, 60–75 mins is the comfort zone.
Sub-1-Hour Remains a Prestigious Benchmark. Only 3,775 runners (24.9%) finished under 60 minutes.
There is a long Tail of casual runners, with nearly 42% of the runners taking more than 70 minutes. Over 1,100 runners finished beyond 1h:45m.
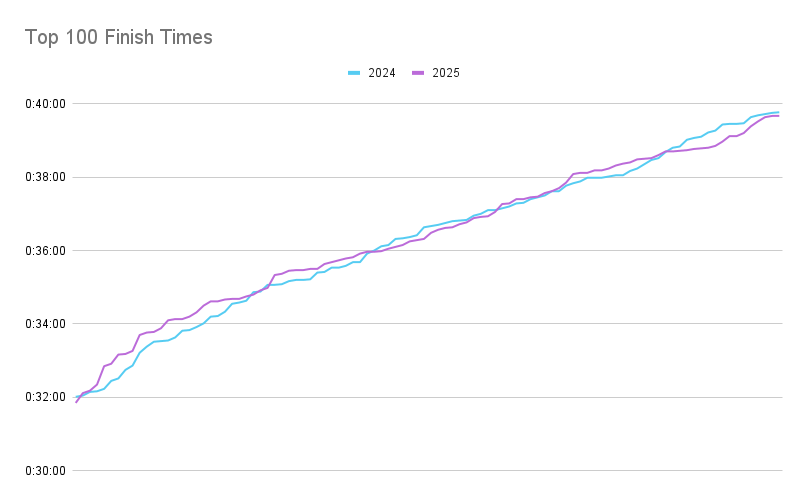
Only 357 runners (2.3%) finished under 45 minutes, indicating competitive amateurs make up a small segment of large running events like TCS World 10K. That said, over 1060 runners finished under 50 minutes (compared to 890 runners), which is a major milestone in performance awareness among recreational runners in India.
Fast Pack is largely male. In the sub-40 and 40–50 minute bands, they account for just 0.9% and 4.5% of finishers respectively. This reflects the performance gap at the top end.
Mid-Pack is where female finishers sees its biggest jump, with more than 1200 women finishing in 60–80 minute band.
Beyond 90 minutes, women account for nearly one-third to half of finishers: 32% (1h:20–1h:30), 39% (1h:30–1h:40), and 48% (1h:40–1h:50).
The slowest packs (over 2 hours), women actually outnumber men (~60% share)
There is no race day tee for TCS Open 10K. But there is a Asics finishers tee, which is a performance reward, reserved for the top 1000 male and top 1000 female finishers in the Open 10K.
Based on finish times, the cutoff for earning this tee in 2025 was:
Men: 49:05 or faster
Women: 1:12:38 or faster
That means only about 7.7% of all male finishers and 27% of female finishers made the cut, making the Finishers Tee especially competitive on the men’s side.
The cutoff times are based on the provisional times published. Please wait for the official communication on finishers tee.
One of the common complaints about past TCS World 10K editions is the start-line management and the initial rush. We’ve look at the data to see how that has handled this year.
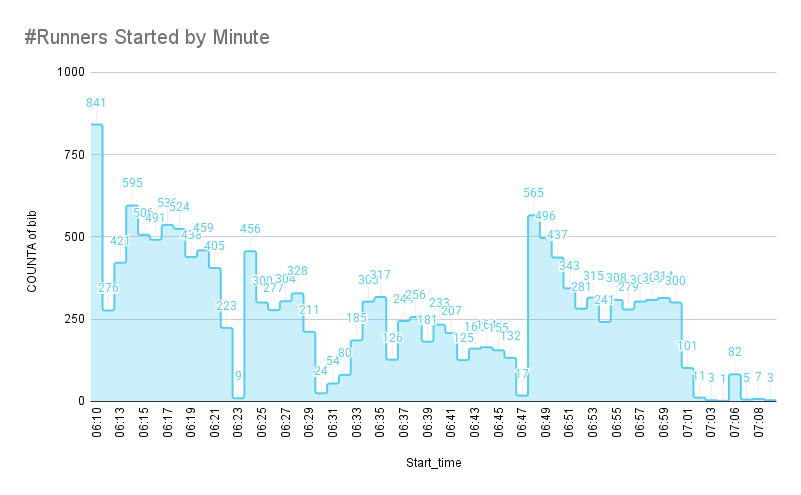
How effective is the wave system that was introduced this year? The data says, it is quite effective. The runners' start is well distributed starting from 6:10am to 7:00am.
About 840 runners passed through the start-line mat in the very first minute of the race, compared to 1000 last year. 25% of all the open 10K participants passed through the mat in first 10 minutes of the race, compared to first 5 minutes last year. As can be seen in the chart, the crowd is uniformly distributed, and clusters can be seen reflecting the start waves. Kudos to PROCAM for finally making this possible.
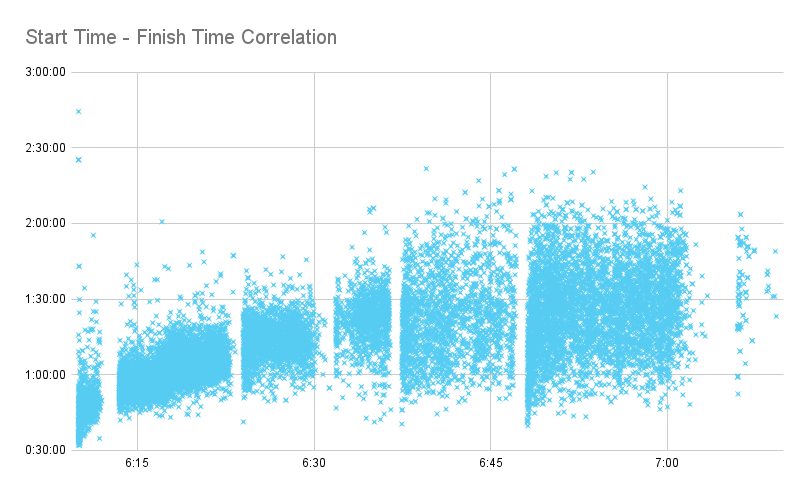
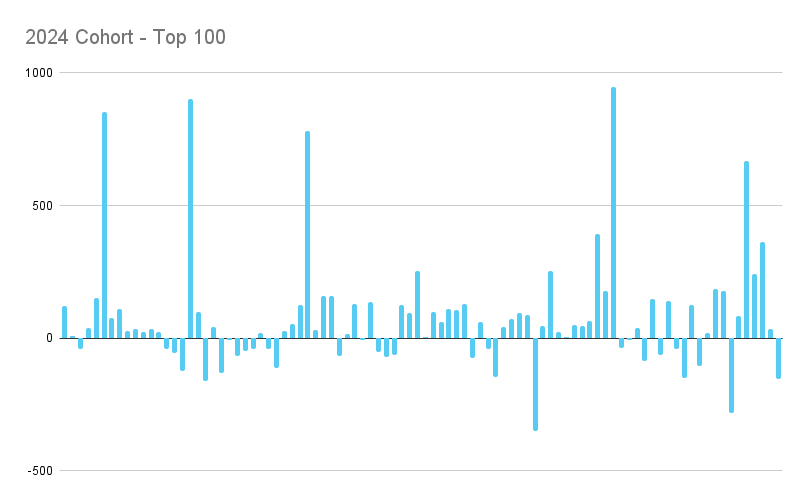
The new course in 2025 is almost the same as last year, but reversed. Initial downhill section, hills in the middle, and a fast finish section is quite challenging. Surprisingly only 14.6% of the runners finished with negative split, when compared to 11% in the last edition.
Interestingly 34 runners (0.2%) were able to finish with equal splits to the second.

Hope you have liked the insights. If you find any additional insights, please do write to us via email or through any of our social media channels.

Aravind is a technologist, marathoner, and self-confessed running shoe geek. He’s passionate about the intersection of technology and running, with a keen interest in running mechanics. Aravind is also the co-founder of GeeksOnFeet, a platform dedicated to helping runners train smarter through data, technique, and community. Find him on Twitter: @imgeeksonfeet