We are born to run; however efficient running depends on several variables interconnected in complex ways. Running form impacts performance, economy and can also be a root cause of several injuries. We are starting a series of articles on running form; cadence being the first amongst them.
Simply put cadence is the steps taken per minute during a run.
Speed, it is directly proportional to two variables, Stride Length and Cadence.
Running Speed = Stride Length X Cadence
Speed (meters/minute)=Stride Length ( meters) Cadence (strides/minute)
Stride length is a function of force a runner generates when they hit the ground, while cadence is how quickly one repeats their stride. Of the two; cadence is easily measurable, with the help of a sports watch. Improving cadence comes with the benefit of reducing injury rate (more on injury prevention later). Using a sports watch you can start observing the correlation between your pace and cadence fairly easily.
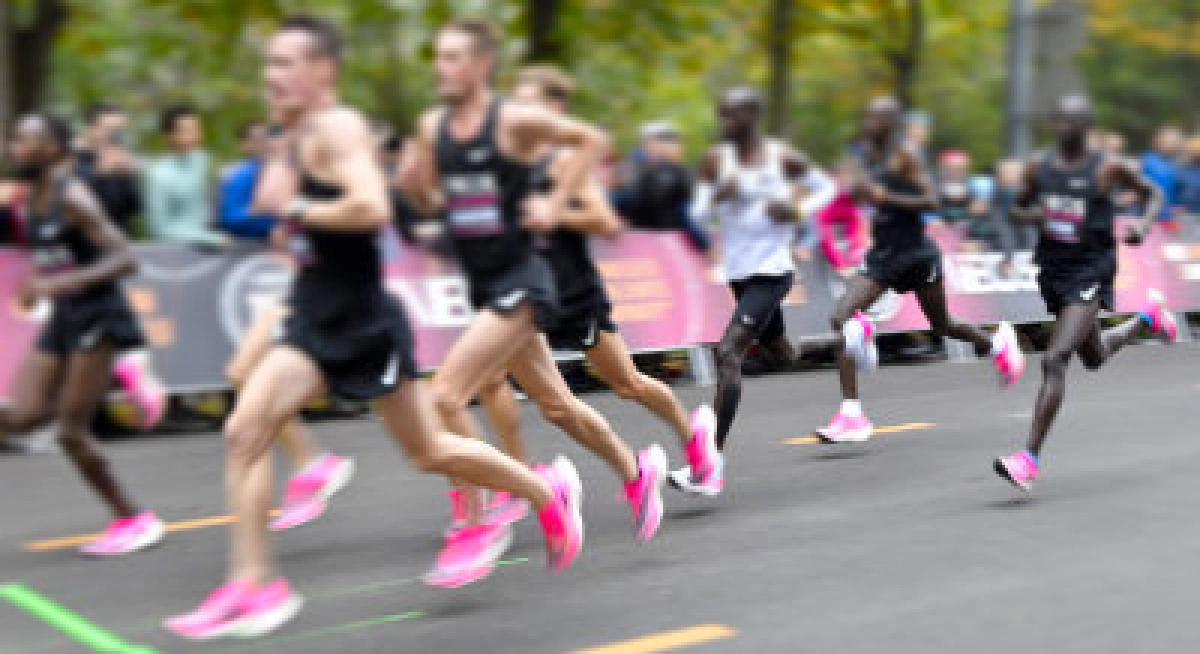
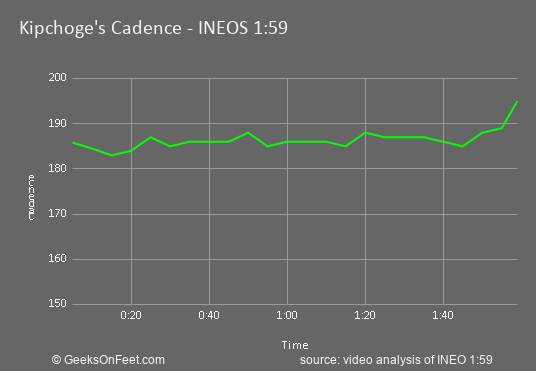
Kipchoge’s INEOS 1:59 run is a good example that illustrates the correlation. He upped his cadence significantly during the last mile and upped it further during the finishing kick.

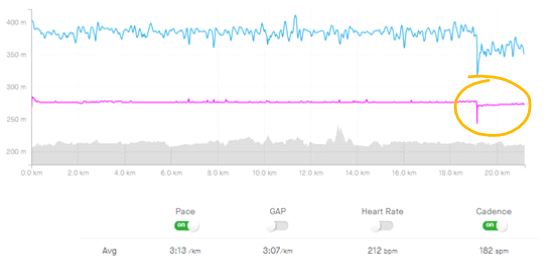
Here is another example - the plot below shows one of the top ADHM 2019 finishers pace and cadence (sourced from Strava) which illustrates this correlation clearly.

This particular runner ran at an average pace of 3 minutes till about 18 kms, cadence was upwards of 182 till then, after 18 km pace dropped to 4 min/km, cadence also dropped significantly to 176 spm.
Dr. Jack Daniels, legendary running coach, two time Olympic medallist and author of the book “Daniels' Running Formula”, is one of the first to analyse Cadence closely. During 1984 olympics he examined runners, in various distances and concluded that most runners have running cadence upwards of 180. He suggested that it is important to have cadence higher than 180 to minimize the ground impact when landing. Dr. Daniels ran his cadence experiments using video footage and manual observation. How about repeating these cadence experiments ourselves? Wouldn’t it be painstaking?
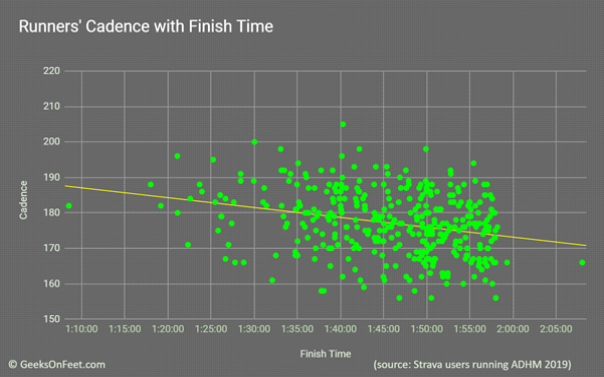
We downloaded ADHM 2019 finishers data from Strava. Analysed the cadence of all the finishers below 2 hours finish time. Plotted the cadence and finish time of the runners below.

As you can see in the plot above, faster runners on average had higher cadence compared to the rest. As the finish times got longer average cadence has dropped, starting at about 190 and dropping to 170. These observations confirm to Dr. Jack Daniels’ original observations.
Straight answer is none. Popular literature often cites 180 as the ideal cadence citing Dr. Jack Daniels observations. But as you can see from ADHM analysis data averages are not everything. There are quite a few finishers under 90 minutes, have cadence less than 170. What we can possibly conclude here cadence is highly individualized and varies from runner to runner significantly.
Taller runners often have less cadence compared to shorter runners. BUPA Great North Run 2013, a classic race finish between Mo Farah and Kennesia Bekele is a great illustration of cadence variances. Mo Farah increases his cadence from 180 to 200 in the last 2 minutes to finish. While Bekele ups his cadence from 190 to 210. Both finishes few seconds apart, Bekele winning the event. Both have their natural cadences at different levels.
If 180 is not the ideal cadence, then what cadence to train for? The goal of cadence improvement is to find the highest cadence that is most natural for you and optimum for running economy.
We will come back soon with a follow-up article on specific drills and running workouts that you can include in your training regime to improve your cadence.
References:

Aravind is a running geek, marathoner, and CrossFitter. He loves all things technology and technology in running, with special interest in running form analysis.