

Insights from the New York City Marathon finisher timing data

With 53000+ finishers, TCS New York City Marathon is the world’s largest marathon. Given the scale and the global nature of the event, the data from the event most likely candidate to provide insights on long distance running. We took a deep dive into the timing data (sourced from the official website), to uncover these insights.
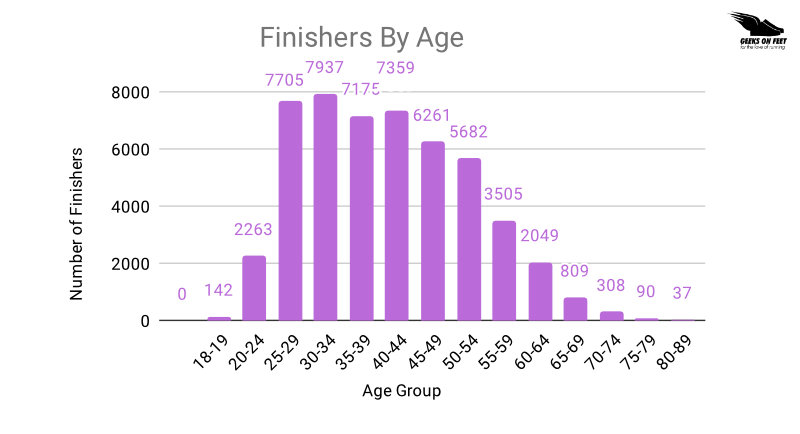
NYC Marathon organizes runners into age groups on a 5 year age scale starting at 18-19, 20-24, 25-29, etc.,
The ‘30-34’,‘25-29’,‘40-44’ age groups have the highest number of finishers, with 7,938, 7,705 and 7,359 runners respectively. We can probably infer early 30s to mid-40s is the peak marathon age.
It is also very encouraging to see ‘25-29’ age group has a significant number of runners. This indicates long distance running is gaining popularity among younger population.
There’s a gradual decrease in participation with increasing age. The ‘50-54’ and ‘55-59’ age groups have 5,682 and 3,505 runners respectively, showing a notable drop-off as age increases.
The youngest age group ‘18-19’ has 142 runners, and the oldest age groups ‘75-79’ and ‘80-89’ have 90 and 37 runners respectively. That said, considerable number of runner in the ‘50-54’ and ‘55-59’ age groups (5682 & 3505), indicating that many runners continue participating in marathons beyond the age of 50.
Age and Performance
Here is more scatter plot of age and finish times varied across the finishers.
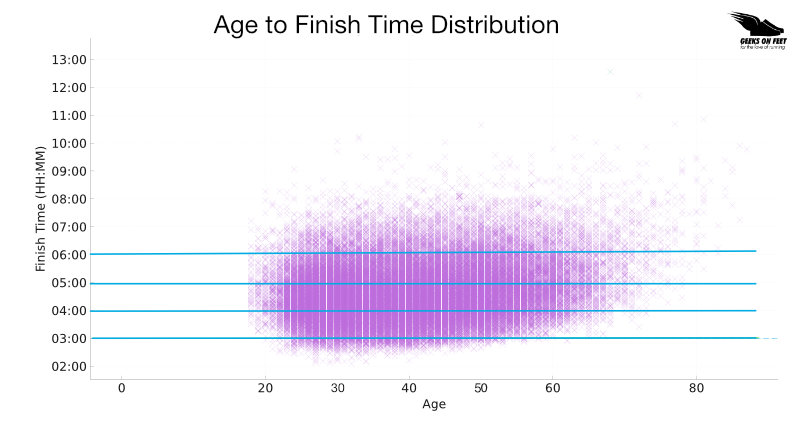
There is significant variability in finish times within each age group, indicated by the vertical spread of points at each age. This spread suggests that factors other than age may also significantly influence marathon performance.
If you see the data below 3 hours, there is a small but reasonably consistent trend of performance decline with increasing age, especially after 40 years. It seems to accelerate after 50 years, with hardly anyone finishing below 3 hours after 60 years of age.
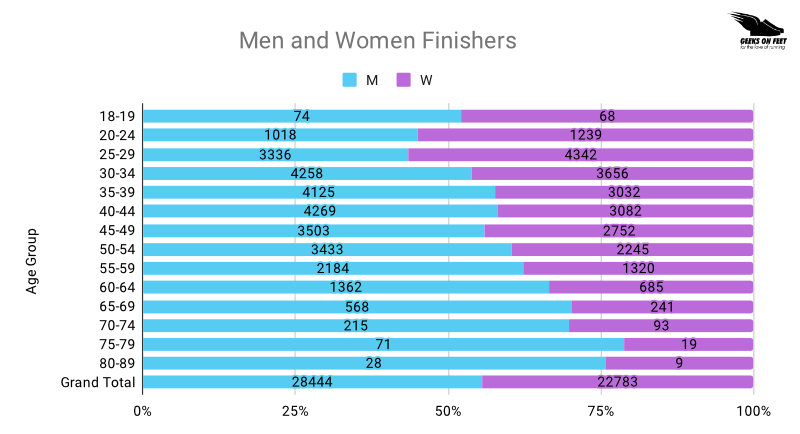
There is well balanced representation of men and women finishers, with women making up almost 45% of finishers.
What is even more interesting is, in the younger (‘20-24’ and ‘25-29’) age groups, there are more female than male runners, indicating strong participation among younger women.
In the middle (‘30-34’ and ‘35-39’) age groups, male runners outnumber female runners, reversing the trend observed in younger age groups.
Typically, marathon participation in India is heavily skewed towards men, with women making up less than 10% of finishers. This underlines the need for more initiatives to encourage women to take up running and participate in races in India.
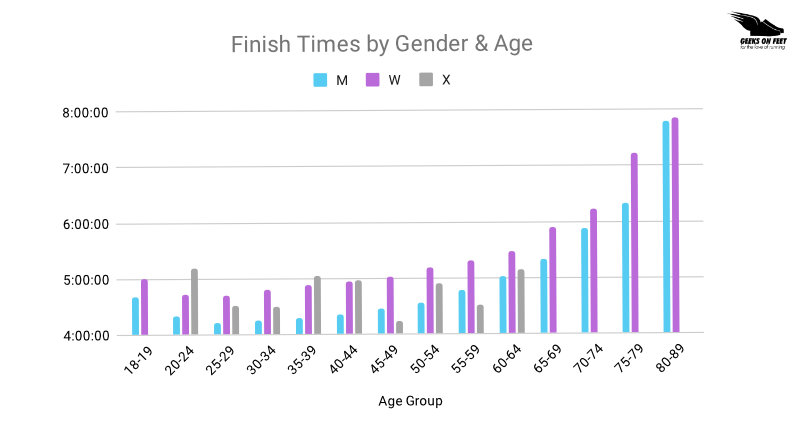
The performance of Men vs. Women
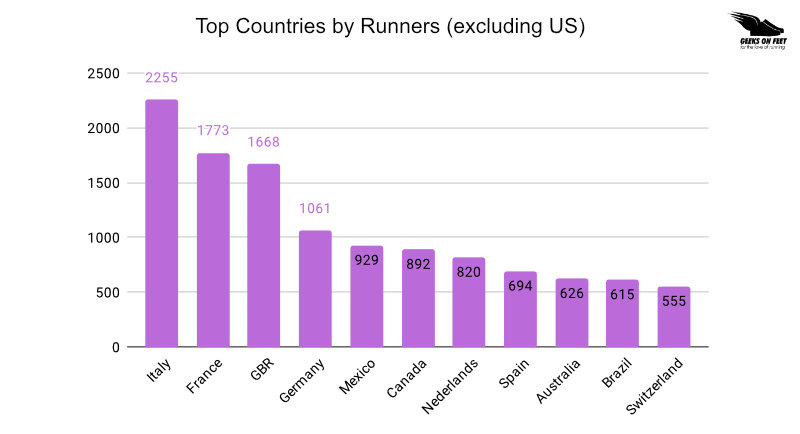
There are finishers from 148 countries in total, representing all the continents. If we exclude the US (host country), we can see that the majority of finishers come from countries in Europe, and Americas. Italy is at the top with the highest number of finishers (2255). But I wonder why so?
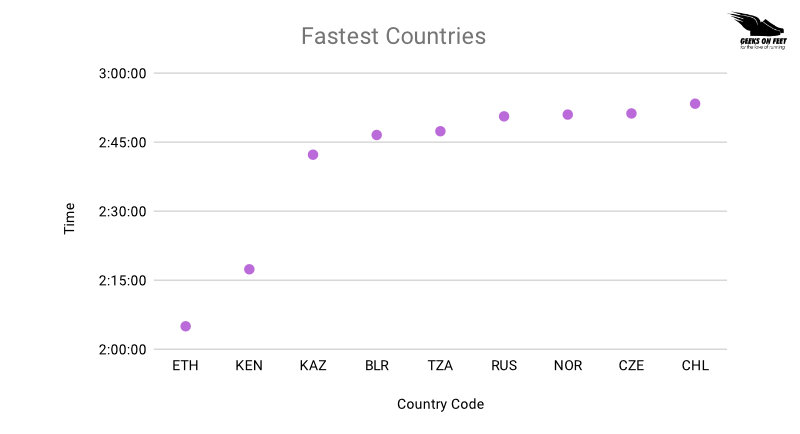
Fastest Countries
This is a tricky one to identify, given the averages are skewed for countries that have more runners participating. To make it fair, I took the top 10% of the finishers from each country and averaged the finish times.
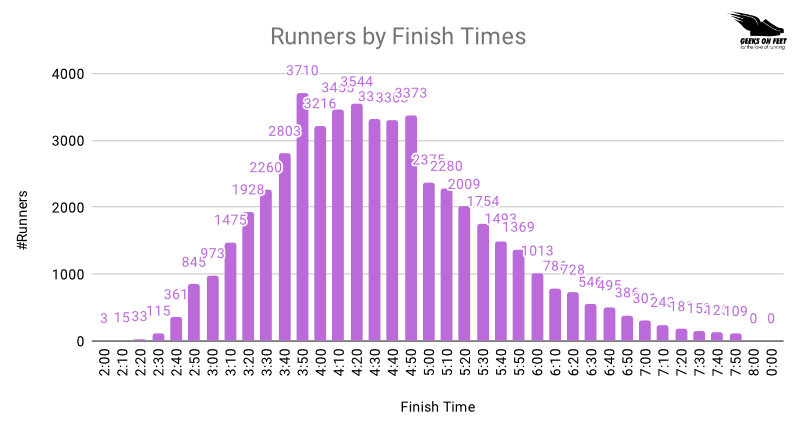
The largest number of runners finish between 3:40 and 4:20, with the peak at the 3:50 to 4:10 interval. 4:00 hours is often considered a benchmark for amateur marathon runners. Be proud, if you have run a 4 hour marathon.
After the 5-hour mark, the number of finishers begins to steadily decline. That said, there is still a considerable number of finishers up to the 10-hour mark. Marathon is not always about speed, but also about the finish.
Splits of Top 5 Finishers (Men)
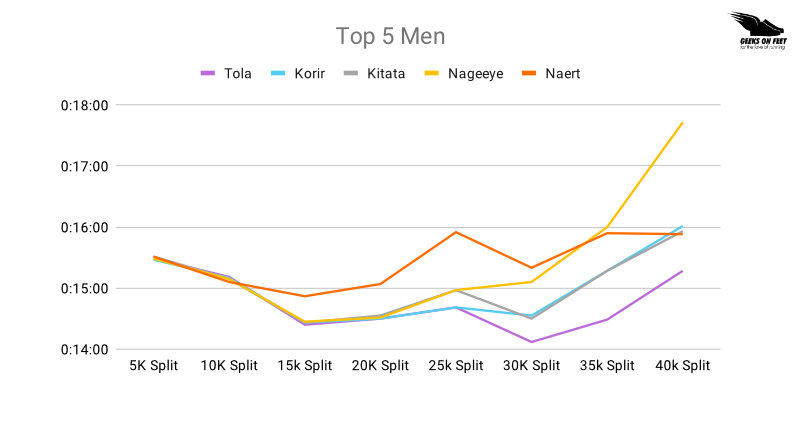
The top 5 men maintained a very consistent pace and ran as a pack during the first half of the marathon (up to 20K).
There’s more variability in performance in the later stages (post 25K). Tola, broke away from the pack and ran ahead after 25K. Tola is the only runner to finish with a negative split.
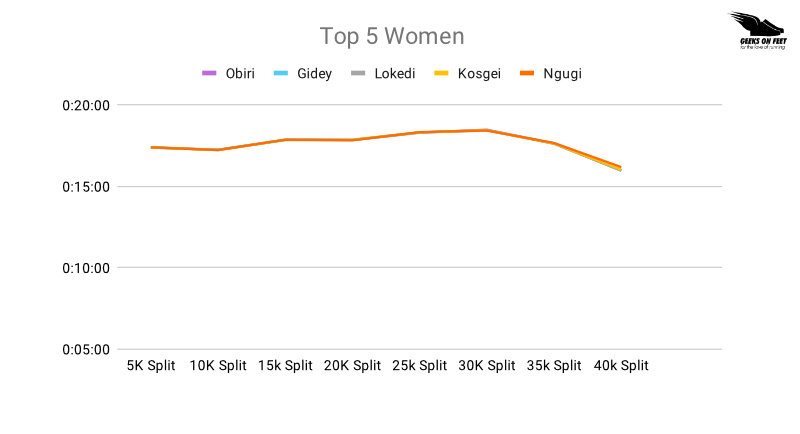
Splits of Top 5 Finishers (Women)
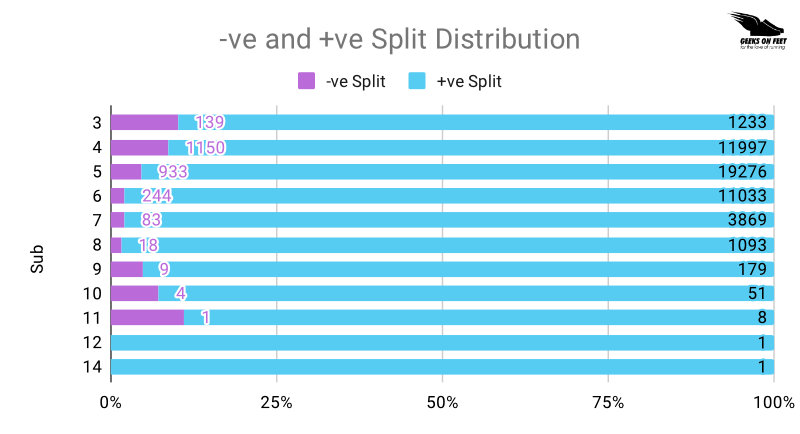
Split Distribution
Only 5% of the finishers employed a negative split strategy, which means they ran the second half of the race faster than the first. This is the lower than what we have seen at London, indicating a tougher course. However, This is higher than the 4% of finishers who employed a negative split strategy in the TMM 2023.
How is 10K split time and the final finish time correlated?
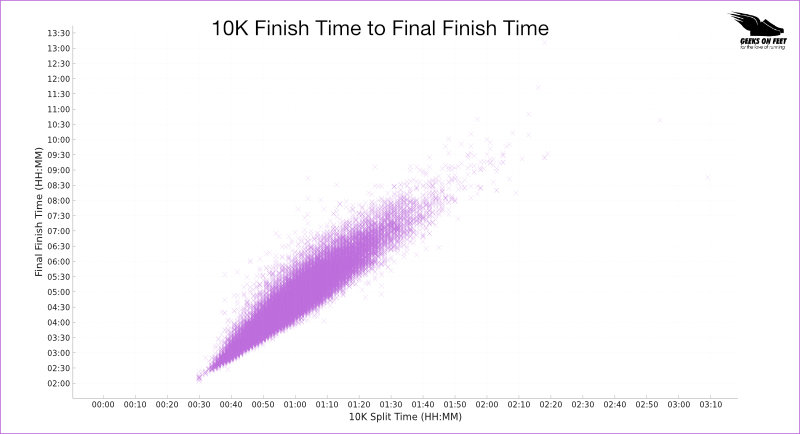
Elite and very fast runners (lower left corner) are grouped closely together, indicating both a fast 10K split and a fast overall time. The tight clustering in the faster segment suggests that faster runners maintain a more consistent pace throughout the race.
This trend seems to spread out as the finish times increase, showing that recreational or slower runners (towards the upper right corner) have more variability in their performance. Slower runners might employ more varied pacing strategies, as indicated by the broader spread of finish times for similar 10K split times.
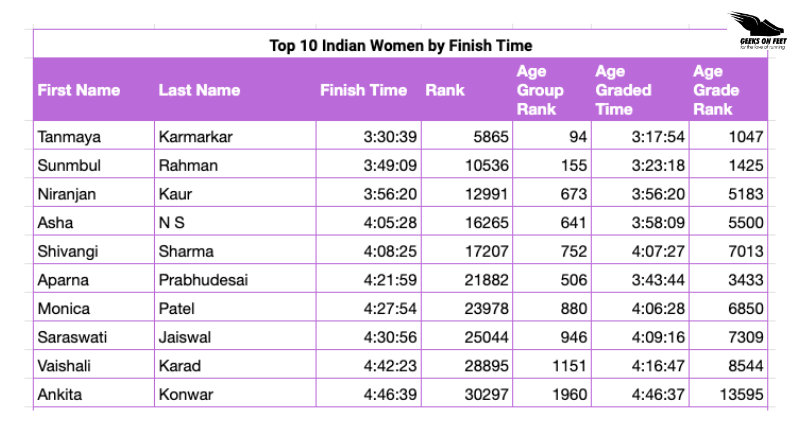
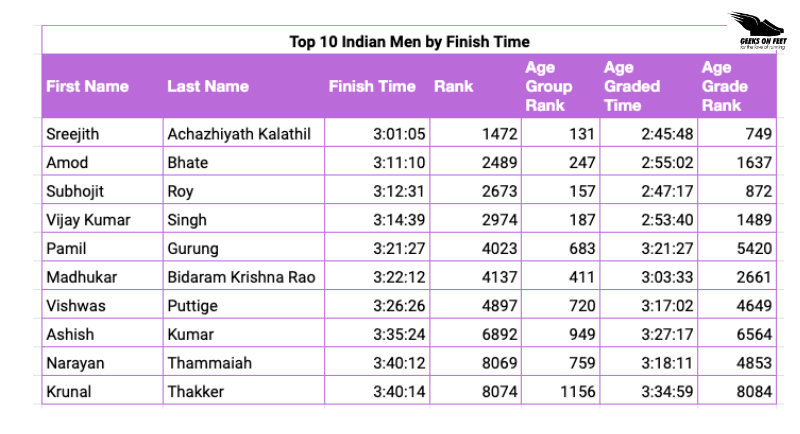
94 Indian residents who finished the marathon, while a total of 373 Indian citizens (residents + non-residents) finished the marathon. Sreejith is the fastest among Indian Men, while Tanmaya is the fastest among Women.
Here are the top 5 cities from India
| City | #Finishers |
|---|---|
| Mumbai | 19 |
| Bengaluru | 16 |
| Pune | 15 |
| Gurugram | 7 |
| Hyderabad | 5 |
Comparing Boston & London Marathos’s data to NYC Marathon data is interesting, given NYC marathon is larger.
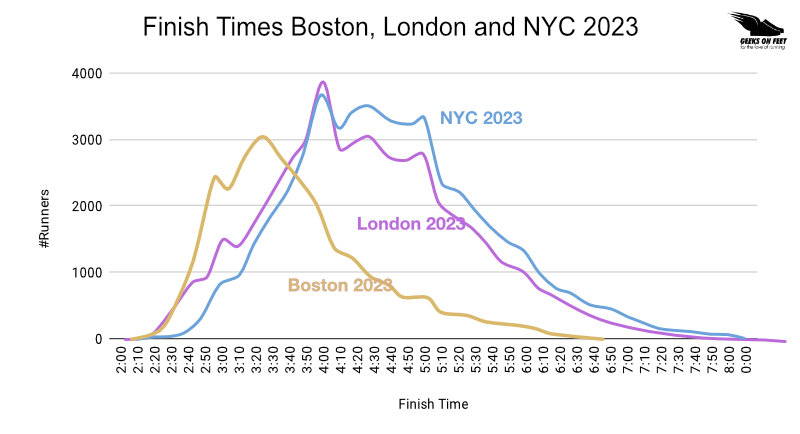
Which is harder? Boston or New York?
This one is harder to say. Hellen Obiri, who won the double of Boston & New York City marathons this year, has said the New York City marathon course is much tougher. Here is plot of finisher distribution across London, Boston and New York Marathons of 2023. As you can see more runners have finished under 3 hours in Boston, and London than New York. Given the weather this year is more or less similar across the three marathons, that probably indicates New York is much tougher course than Boston and London.
If you’ve liked what we have done here, here is how you can support us.

