

TMM 2023 post race data analysis

The Tata Mumbai Marathon, is the largest running event in India, and just concluded its 18th edition. Since it came back after a hiatus of three years, there was a lot of excitement. True to its status as the marquee event of India, it didn’t disappoint this year either. Excellent weather conditions, some unexpected route changes made it very interesting for the participants. As GeeksOnFeet, we continue our tradition of crunching the numbers, and here are some insights.
The marathon distance participation has been growing over the years, with about 16% growth in finishers from 2019 to 2020.Despite the event happening after 3 years, and all the hype around it, the marathon event saw a dip in the finisher numbers this year. There were 7201 finishers, with a 7% drop compared to the 2020.

The half-marathon distance participation has been steady over the years. That is largely because of the organizers restrictions on the entry due to limited space. Change in the route, and the new start-point, probably made this year one of the lowest in the last 10 years. A total of 10,993 finished the half-marathon distance, roughly 13% drop from the previous edition.

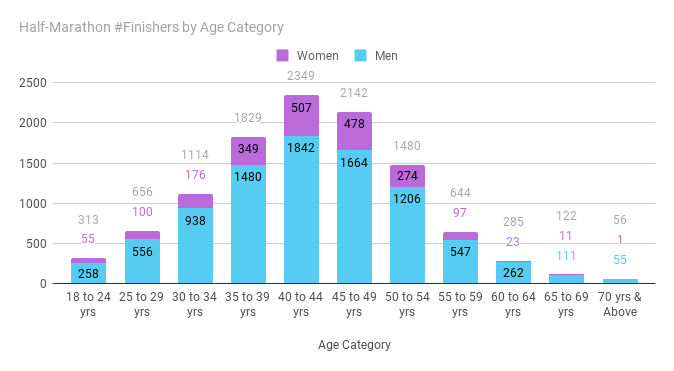
Continuing the trend from the previous editions, the 40-44 age group saw the most number of finishers, both in marathon and half-marathon categories. This distribution of Age categories is inline with Global marathon and half-marathon participation trends. However, the 10K finisher trends that we observed in TCS World 10k 2022 are different though. We see the most finishers age category shifting left with most in 30-34 category.
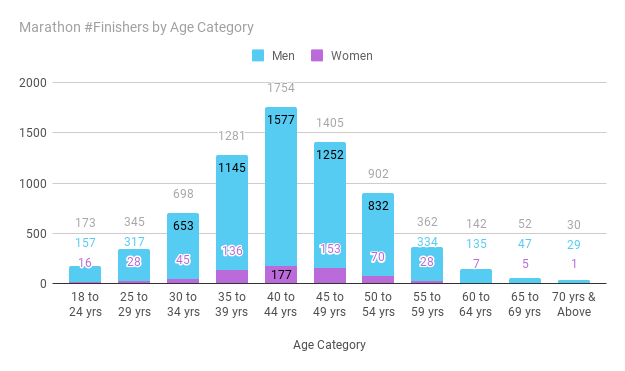
Women finishers in both marathon and half-marathon have slightly improved this year from the last event with 9% of total finishers in Marathon, and about 19% of finishers in half-marathon are women.
The Mumbai marathon course gets tougher in the second half, and hence the positive split finish is the most common. Over 96% finished with positive splits, and only 4% finished with negative splits. What is interesting is that only one of the 54 sub 3 hour marathon finishers have finished with a negative split.

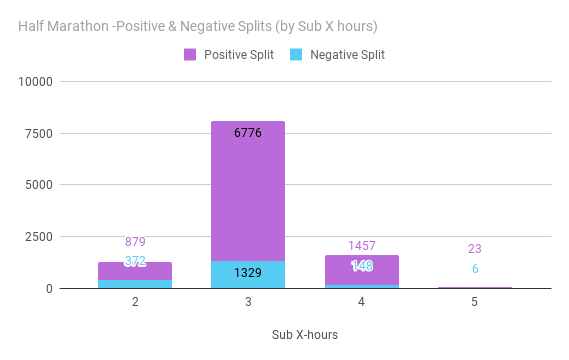
Half-marathon finishers have much better negative splits. 17% of have finished with negative splits. 30% of those finished under 2 hours had negative splits.
Update: Negative split finish in a Half-marathon couldn’t be calculated correctly there is no timing mat at mid-point. Earlier version of this post used 10K point as mid-point, which is incorrect. We’ve now updated to use the difference between 10K pace to race pace. While this is not very accurate, but probably is close.
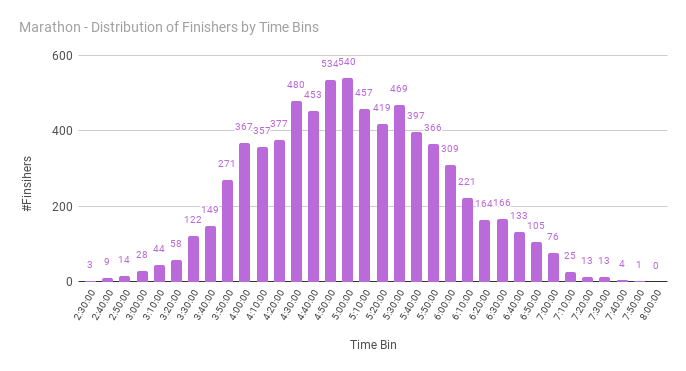
We have taken 10-minute slices of finish times, and it is between 4h:40m and 4h:50m where most runners have finished.
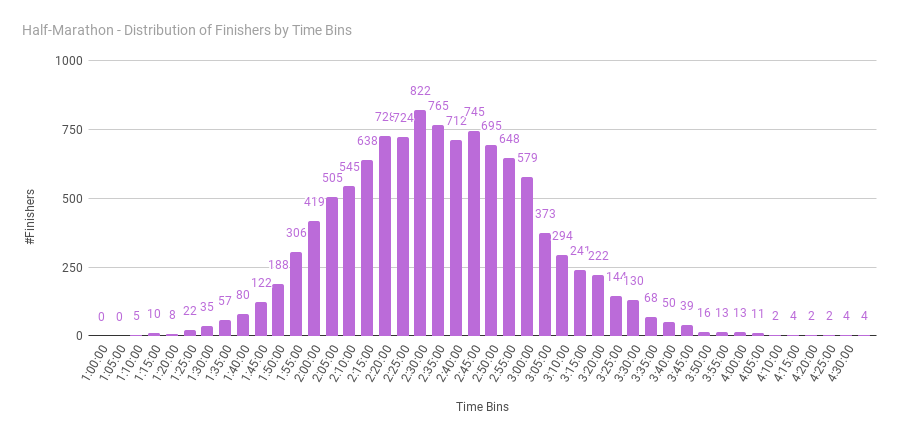
We have taken 5-minute slices of finish times for half-marathon, and it is between 2h:25m and 2h:30m where most runners (822) have finished. As with most data, the distribution indeed follows a nice bell curve with a long head and a tail.
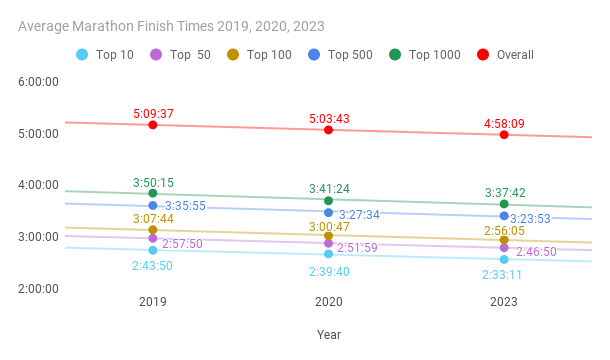
We’ve looked at the average marathon finish time of Top 10, 50, 100, 500, 1000 runners over the last 3 years. Interestingly the finish times are consistently improving. Average for Top 10 is an impressive 2h:33m compared to 2h:43m over 5 years ago.
Sub-3 hour finish is the ultimate goal for recreational runners. There are 54 sub-3 hour finishers in this edition, compared to 27 four years ago, and 41 three years ago. Number of sub 4 finishers crossed 1000 mark for the first time in the history of Mumbai marathon.

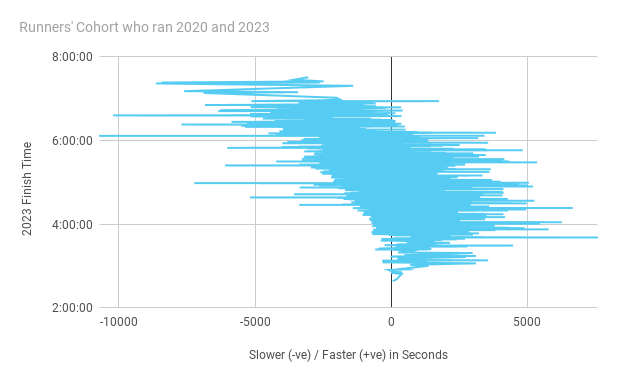
There were about 1400 runners that ran all the 3 recent editions. We’ve tracked their progress across the three editions. Interestingly, the majority of the slower runners got further slower from their earlier timings, while the faster runners got much faster. 80% of the runners who ran under 4 hours in this edition, have improved their timing from the 2020 edition. Only 30% of the runners who ran above 5 hours have improved their timing from the 2020 edition, and the remaining failed to improve.
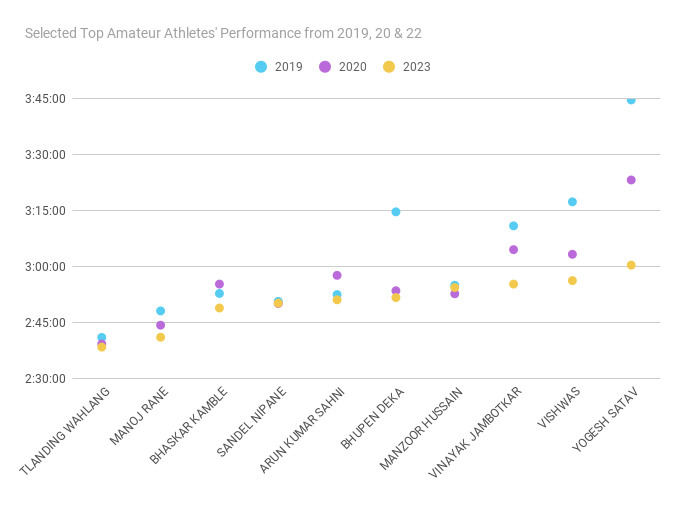
We picked the top 10 runners who ran all the recent 3 editions. What is interesting is all 10 of them have progressively improved over the years.
Have you have liked these insights? If you have found any additional insights, we would love to hear from you. Please share with us via email or through any of our social media channels.
Compiled by Team GeeksOnFeet
Publicly available timing data from sportstimingsolutions.in is used for the analysis.

