

Stastical perspective of Mumbai Marathon 2024

On January 21, 2024, the Tata Mumbai Marathon (TMM) once again captured the essence of endurance, determination, and the vibrant spirit of Mumbai. We delve into the numbers that shaped this year’s event.
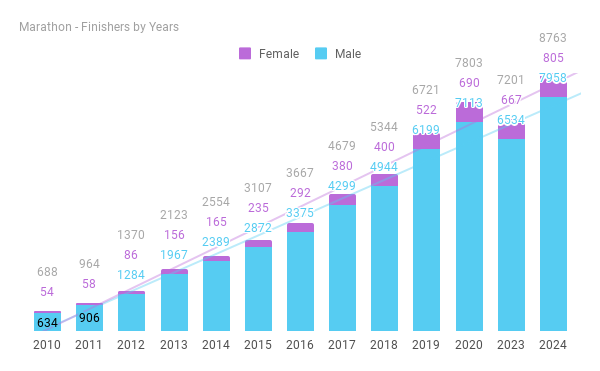
The 2024 edition of the TMM saw unprecedented participation levels in Marathon category, with a 12.30% increase in finishers from the previous record in 2020, marking a significant rebound from the slight dip in 2023, likely influenced by post-pandemic hesitations. Notably, female participation surged by 16.67% from the 2020 high, underscoring a growing inclusivity in the marathon community.
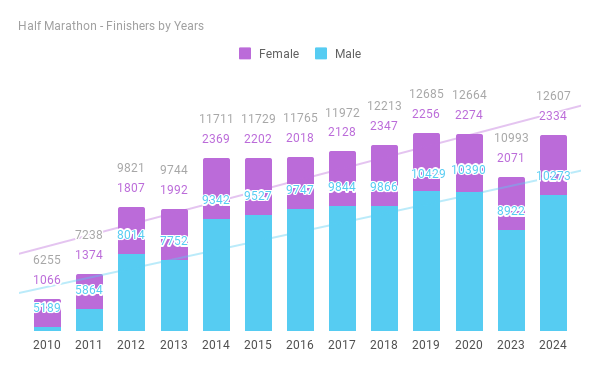
While the marathon distances witnessed growth, the half-marathon maintained a steady participant count, constrained by registration caps. This year, a slight decrease in finishers was observed in both male and female categories compared to their respective peak years. A total of 12,607 finished the half-marathon distance this year.
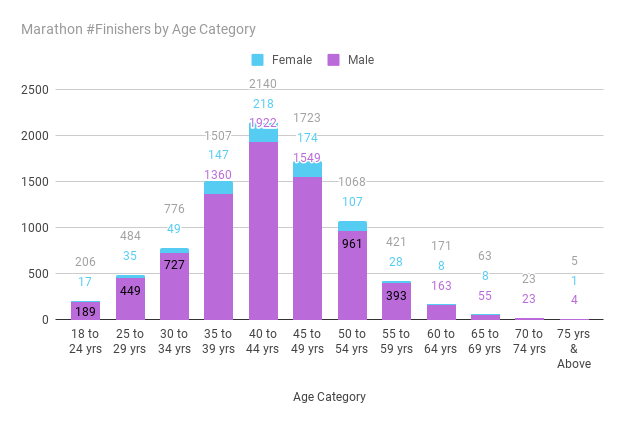
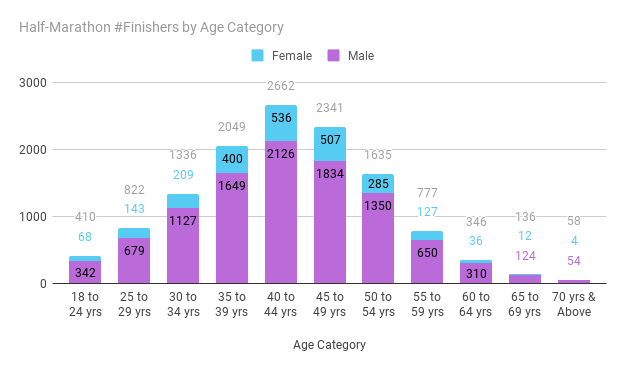
Continuing the trend from the previous editions, the 40-44 age group saw the most number of finishers, both in marathon and half-marathon categories. This distribution of Age categories is in-line with Global marathon and half-marathon participation trends.
Half-marathon distribution across age-categories is similar to the full distance. 40-44 age group has highest number of finishers followed by 45-49, and 35-39.
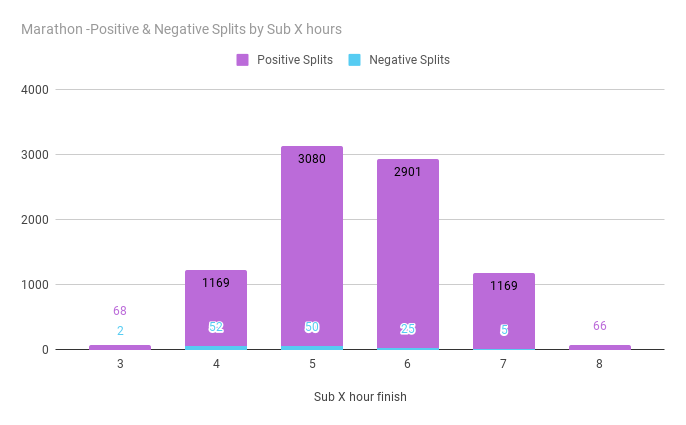
The Mumbai marathon course gets tougher in the second half, and hence the positive split finish is the most common.
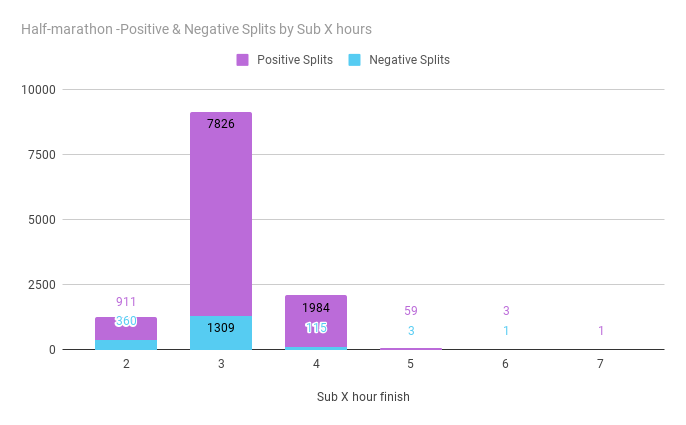
Half-marathon finishers have much better negative splits compared to full distance. 14% of have finished with negative splits. 28% of those finished under 2 hours had negative splits. However, compared to the previous edition negative splits in half-marathon have reduced. 18% have finished negative splits in the previous edition.
Negative split finish in a Half-marathon couldn’t be calculated accurately as there is no timing mat at mid-point. We’ve used 10K pace & race pace to estimate. While this is not very accurate, but probably is close.
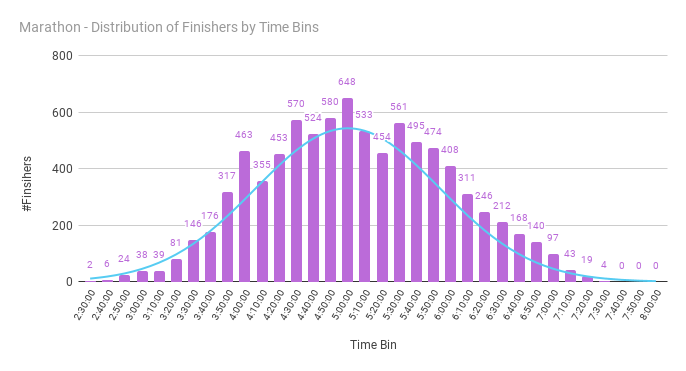
We have taken 10-minute slices of finish times, and it is between 4h:50m and 5h:00m where most runners (648 runners) have finished.
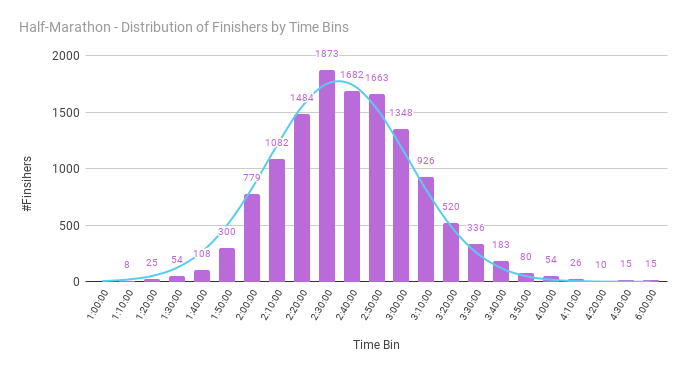
We have taken 10-minute slices of finish times for half-marathon, and it is between 2h:20m and 2h:30m where most runners (1873 runners) have finished. As with most data, the distribution indeed follows a bell curve with a tall head and a long tail.
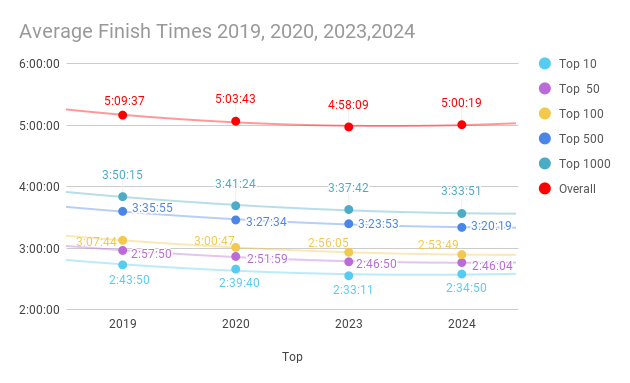
We’ve looked at the average marathon finish time of Top 10, 50, 100, 500, 1000 runners over the last 4 years. The finish times are consistently improving.
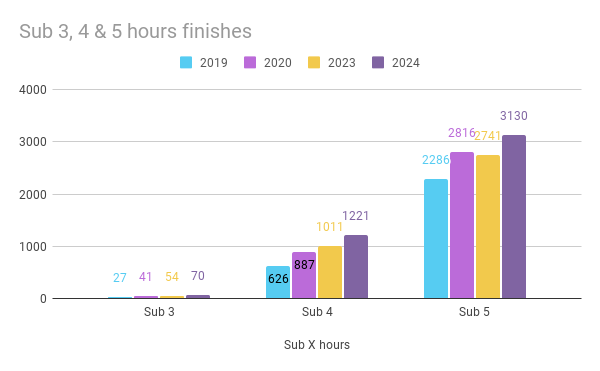
Sub-3 hour finish is the ultimate goal for recreational runners. There are 70 sub-3 hour finishers in this edition, compared to 27 four years ago, and 54 an year ago. For the first time, more than 3000 runners have finished under 5 hours.
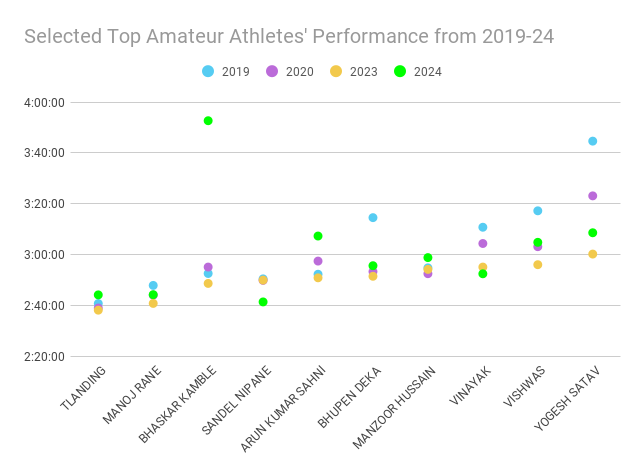
There were about 1000 runners who ran all the 4 recent editions. We picked the top 10 runners (of 2023 edition) who ran all the recent 4 editions. While all 10 of them have progressively improved till last year, few have dropped their times this year.
Have you have liked these insights? If you have found any additional insights, we would love to hear from you. Please share with us via email or through any of our social media channels.
Compiled by Team GeeksOnFeet for the love of running
Publicly available timing data from sportstimingsolutions.in is used for the analysis.
We put substantial time and resources into bringing this content to India's running community. If you like what we do, consider chipping in — every bit helps keep the lights on.
See the Thank You Wall →
