

What actually slows people down in HYROX? A look at the splits from singles finishers at HYROX Bengaluru 2026 (Season 8)

HYROX is the newest format that Indian endurance junkies are in love with. For the uninitiated, it is 8 km of running broken up by 8 workout stations, in a fixed order.
So when one athlete finishes a Hyrox in 1h:30m and the next in 2h:30m, the hour difference between them has to come from somewhere specific. What could that be? What slows down Hyrox athletes? We pulled the full split data of every singles finisher at HYROX Bengaluru 2026 (Season 8) from hyresult.com. A total of 2,768 athletes across the four singles divisions, and we broke each further down run-by-run, station-by-station, and through the Roxzone (the transition between the track and the next station).
| Division | Athletes | Top 25% (median) | Middle 50% | Bottom 25% | Top→Bottom gap |
|---|---|---|---|---|---|
| HYROX Men (Open) | 1,802 | 1:33:28 | 1:56:26 | 2:32:24 | 58:56 |
| HYROX Women (Open) | 624 | 1:47:17 | 2:12:04 | 2:45:27 | 58:10 |
| HYROX Pro Men | 279 | 1:24:45 | 1:54:00 | 2:30:18 | 65:34 |
| HYROX Pro Women | 63 | 1:32:47 | 2:00:13 | 2:40:56 | 68:09 |
A total of 2,768 singles finishers were analysed. Doubles, relays and adaptive categories are excluded. We grouped athletes by tiers, which are by finish-time quartile within each division. All numbers in the rest of the article use medians (more robust to outliers than means).
The shape of the data is the same in all four divisions. So for clarity we’ll use Open Men (n=1,799 valid results) as the worked example and call out the others where they differ significantly.
The race has three time components: 8 runs (8 km in total), 8 stations, and the Roxzone. Splitting the 58:56 top-to-bottom gap in the men’s race across those three:
| Bucket | Share of the gap (Open Men) |
|---|---|
| Running (8 × 1 km) | 48% |
| Workouts (8 stations) | 43% |
| Roxzone (transitions) | 11% |
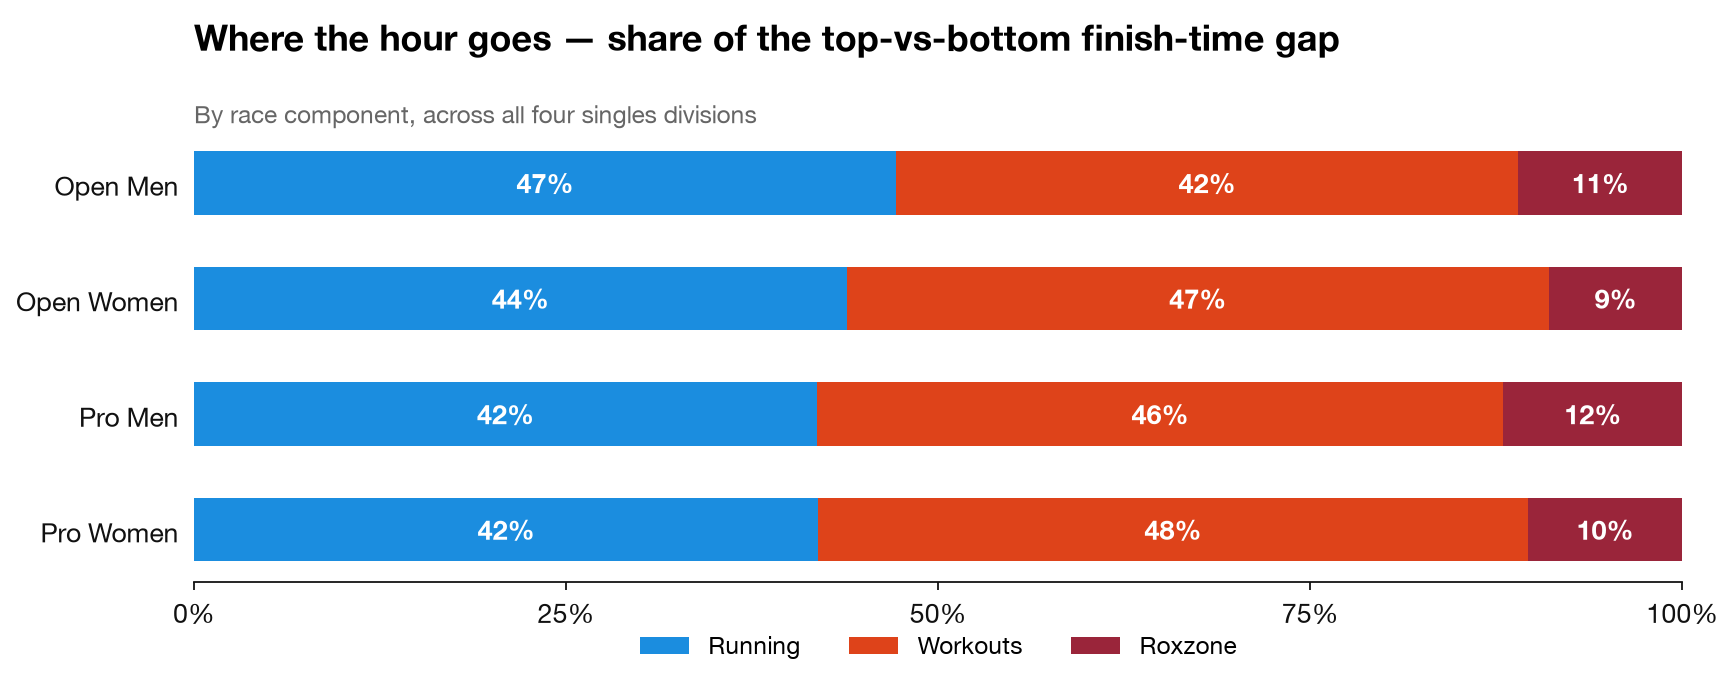
The popular framing of HYROX is “running race with some exercises”. While that may be partly true, the data shows the eight strength stations cost the slower athletes almost as much time as the running does. In the women’s and Pro divisions, slow-down in workouts actually overtake running as the bigger bucket (Open Women: 49% workouts vs 46% running; Pro Women: 52% vs 46%).
And 11% of the gap, close to 7 minutes for the men is lost just standing around in transition (Rox Zone).
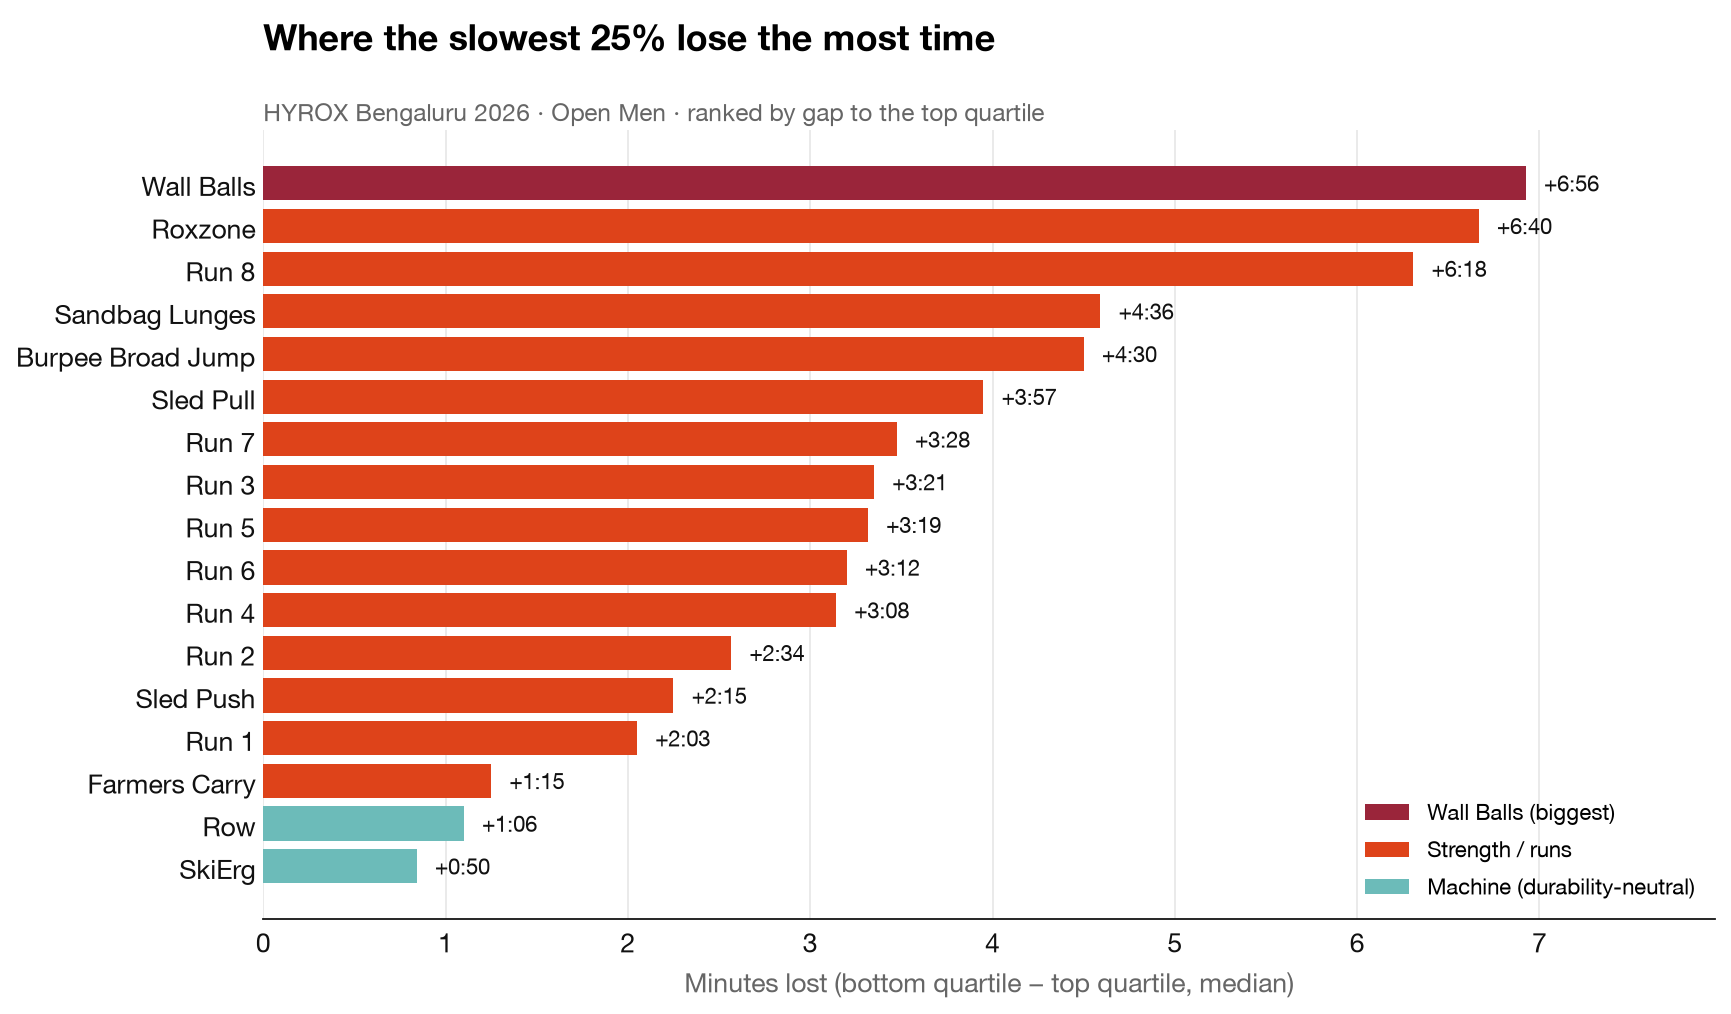
If you rank every station by the raw time difference between the top quartile and the bottom quartile, the same movement wins in every division:
| Rank | Station | Top 25% | Bottom 25% | Gap | % of total gap |
|---|---|---|---|---|---|
| 1 | Wall Balls | 6:54 | 13:50 | +6:56 | 11.8% |
| 2 | Roxzone (cumulative) | 7:36 | 14:16 | +6:40 | 11.3% |
| 3 | Run 8 (final km) | 6:01 | 12:20 | +6:19 | 10.7% |
| 4 | Sandbag Lunges | 5:40 | 10:16 | +4:36 | 7.8% |
| 5 | Burpee Broad Jump | 5:28 | 9:58 | +4:30 | 7.6% |
| 6 | Sled Pull | 5:46 | 9:43 | +3:57 | 6.7% |
| 15 | Sled Push | 3:36 | 5:51 | +2:15 | 3.8% |
| 16 | Farmers Carry | 2:19 | 3:34 | +1:15 | 2.1% |
| 17 | Row | 5:07 | 6:13 | +1:06 | 1.9% |
| 18 | SkiErg | 4:51 | 5:42 | +0:51 | 1.4% |
The Wall Balls station is striking. The bottom quartile takes roughly twice as long as the top:
| Division | Wall Balls: Top | Bottom | Multiplier |
|---|---|---|---|
| Open Men | 6:54 | 13:50 | 2.00× |
| Open Women | 7:29 | 15:54 | 2.12× |
| Pro Men | 6:46 | 15:20 | 2.27× |
| Pro Women | 7:24 | 16:10 | 2.18× |
Our hypothesis: 100 wall balls (squat + throw to a high target) comes dead last in the race, after the legs have already taken 8 km of running plus lunges, sleds and burpees. For a well-prepared athlete it is a steady 7-minute grind. For a fatigued athlete it turns into an ordeal 14–16 minutes of missed targets (which are not counted), and long pauses between reps. No other movement in the race punishes accumulated leg fatigue and target accuracy at the same time. However, we are fairly certain, it is not the wall balls that slows you down, but the accumulated fatigue. The data from the next section supports it.
Because the 16 stations always come in the same order, each one sits at a fixed point on the fatigue timeline. Reading them in the order athletes move through them shows the bottom-quartile multiplier rising as the race goes on:
| # | Station | Top 25% | Bottom 25% | Bottom/Top |
|---|---|---|---|---|
| 1 | Run 1 | 5:00 | 7:03 | 1.41× |
| 2 | SkiErg | 4:51 | 5:42 | 1.17× |
| 3 | Run 2 | 5:06 | 7:40 | 1.50× |
| 4 | Sled Push | 3:36 | 5:51 | 1.63× |
| 5 | Run 3 | 5:34 | 8:55 | 1.60× |
| 6 | Sled Pull | 5:46 | 9:43 | 1.68× |
| 7 | Run 4 | 5:28 | 8:37 | 1.57× |
| 8 | Burpee Broad Jump | 5:28 | 9:58 | 1.82× |
| 9 | Run 5 | 5:35 | 8:54 | 1.59× |
| 10 | Row | 5:07 | 6:13 | 1.21× |
| 11 | Run 6 | 5:26 | 8:38 | 1.59× |
| 12 | Farmers Carry | 2:19 | 3:34 | 1.54× |
| 13 | Run 7 | 5:26 | 8:55 | 1.64× |
| 14 | Sandbag Lunges | 5:40 | 10:16 | 1.81× |
| 15 | Run 8 | 6:01 | 12:20 | 2.05× |
| 16 | Wall Balls | 6:54 | 13:50 | 2.00× |
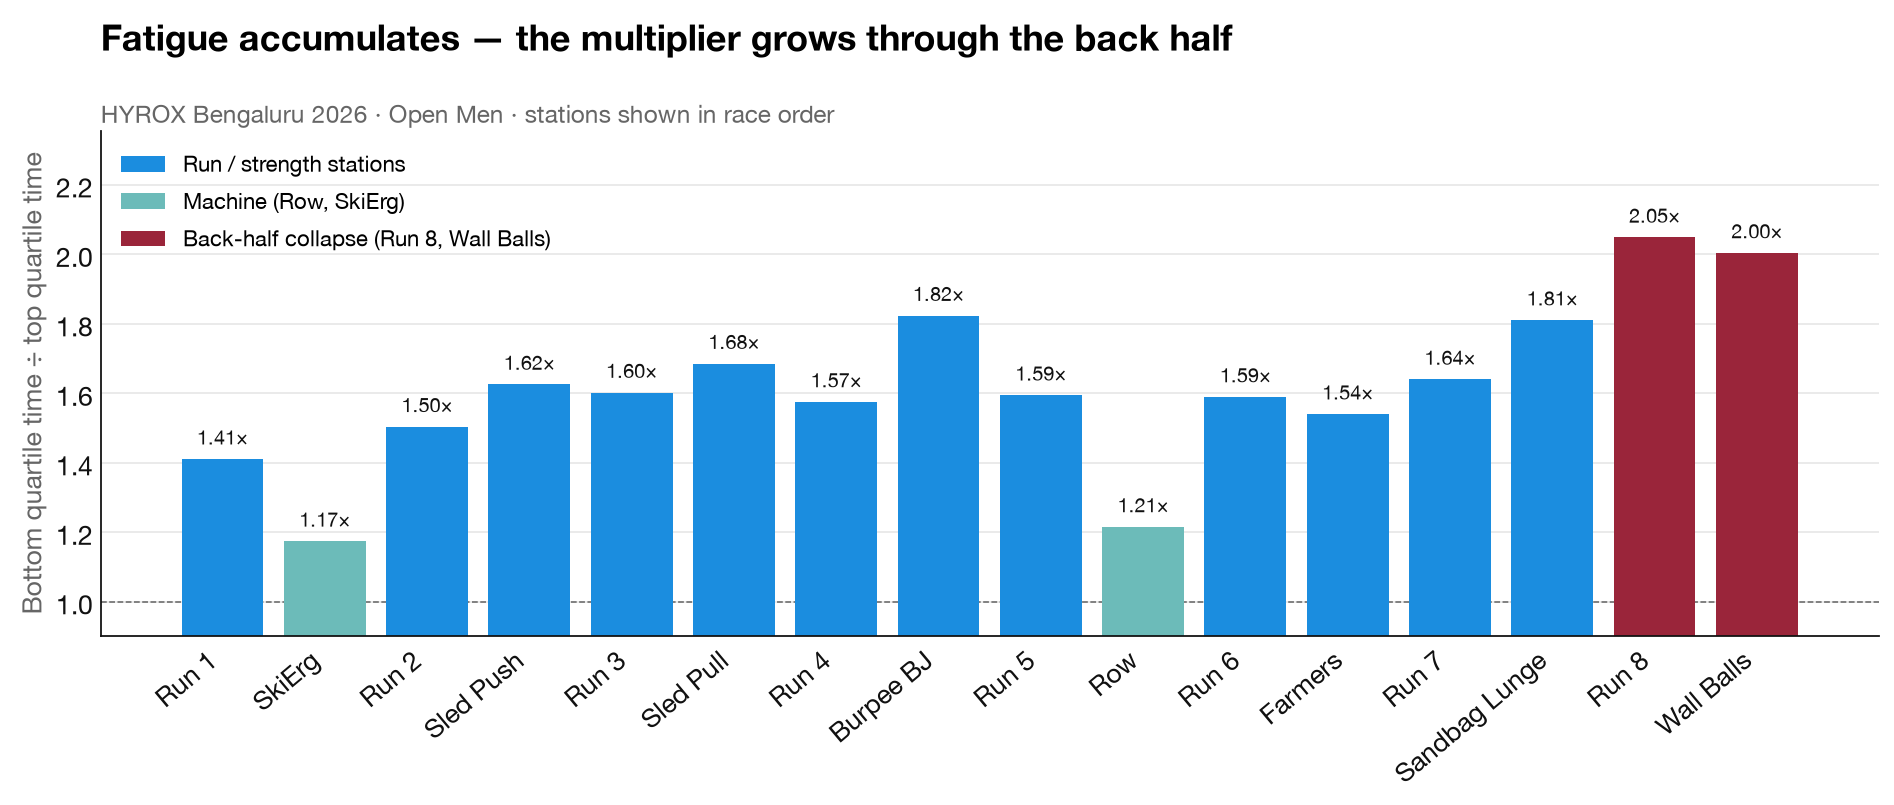
The patterns are worth noting.
More than half of the hour-long gap is in the final third of the race. So HYROX is not won by who is fastest when fresh, but who slows down least towards the end.
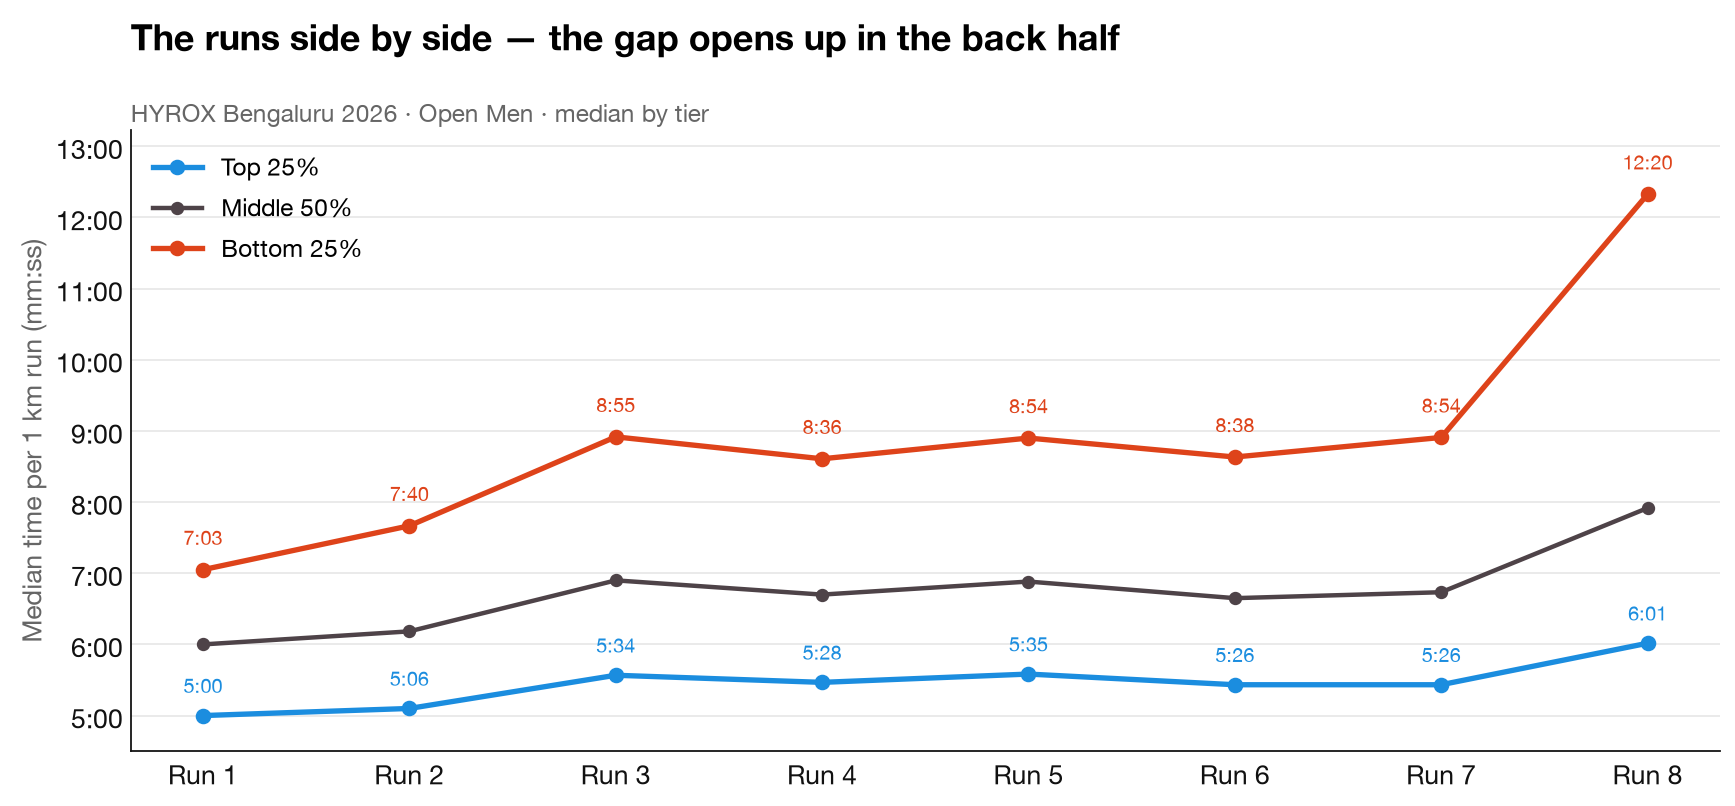
Run 8, the final kilometre, is the 3rd biggest differentiator in the men’s field. Reading the eight runs side by side shows the gap opening up over the race:
| Run 1 | Run 2 | Run 3 | Run 4 | Run 5 | Run 6 | Run 7 | Run 8 | |
|---|---|---|---|---|---|---|---|---|
| Top 25% | 5:00 | 5:06 | 5:34 | 5:28 | 5:35 | 5:26 | 5:26 | 6:01 |
| Middle 50% | 6:00 | 6:11 | 6:54 | 6:42 | 6:53 | 6:39 | 6:44 | 7:55 |
| Bottom 25% | 7:03 | 7:40 | 8:55 | 8:37 | 8:54 | 8:38 | 8:55 | 12:20 |
| Bottom − Top | +2:03 | +2:34 | +3:21 | +3:09 | +3:19 | +3:12 | +3:29 | +6:19 |
The bottom row in the table is the interesting one. On Run 1 the slow quartile is only ~2 minutes behind per km. The gap creeps up through the middle of the race, then nearly doubles on the final run to +6:19.
The Roxzone is the cumulative time between finishing a run and starting the next station, plus the jog back to the track.
| Tier (Open Men) | Roxzone time | as % of total race |
|---|---|---|
| Top 25% | 7:36 | 8.1% |
| Middle 50% | 10:19 | 8.9% |
| Bottom 25% | 14:16 | 9.4% |
The fast athletes treat the Roxzone as part of the race, while the slower group seems to treat it as a rest. The slowest men spend over 14 minutes.
Everything above, the Wall Balls slowness, the Run-8 blow-up, the time at Roxzone, all indicate: durability, or fatigue resistance is the separator between top and bottom.
Four ways to look at this:
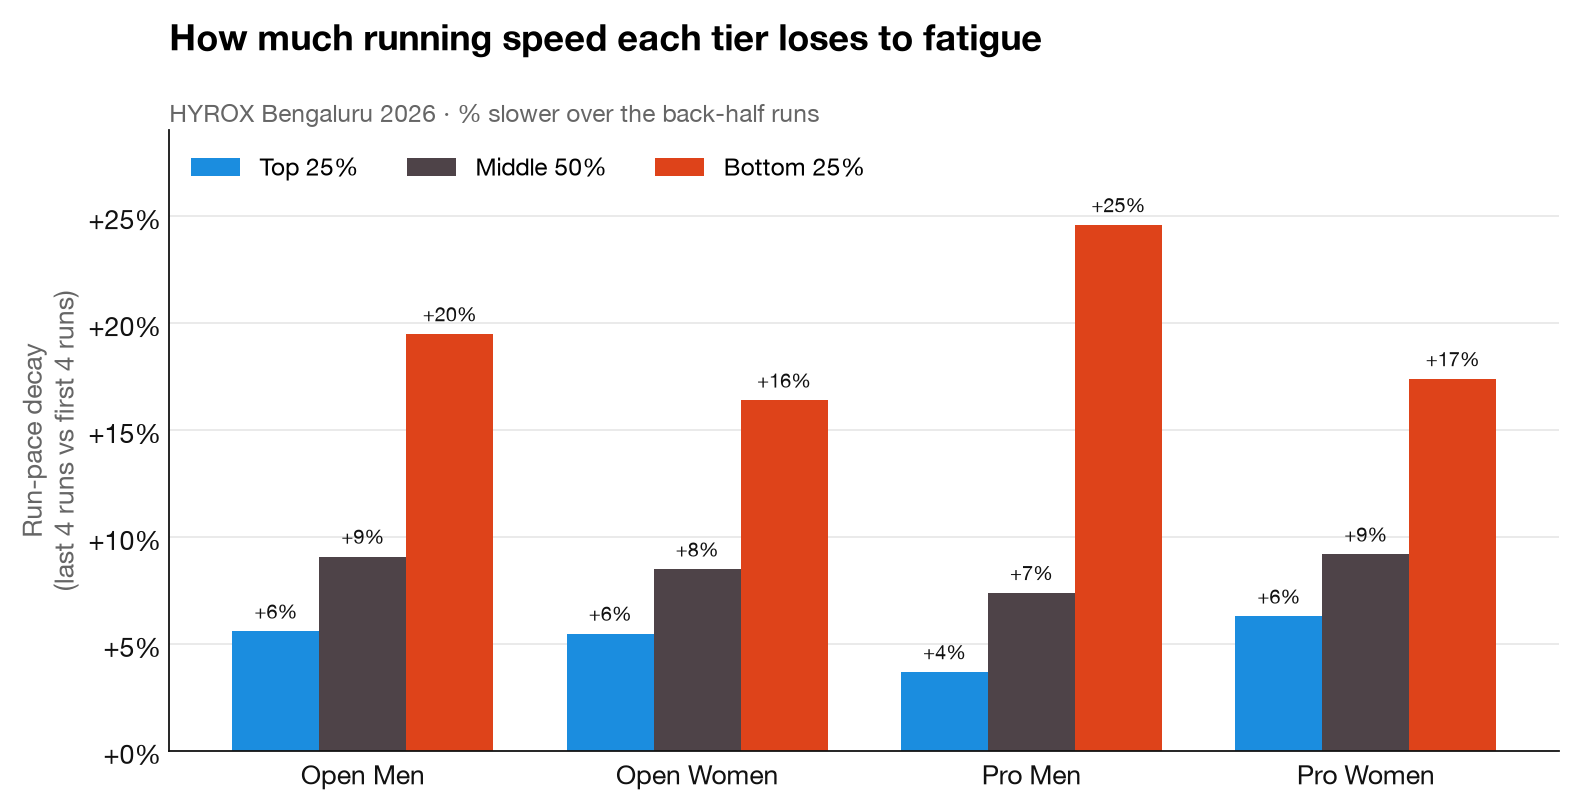
1. Run pace decay. Average pace over the first four runs vs the last four:
| Tier (Open Men) | First 4 runs | Last 4 runs | Decay |
|---|---|---|---|
| Top 25% | 5:19 /km | 5:38 /km | +6% |
| Middle 50% | 6:30 /km | 7:07 /km | +9% |
| Bottom 25% | 8:08 /km | 9:57 /km | +20% |
The top quartile gives up ~19 seconds per km. The bottom quartile gives up almost two minutes per km — they lose a fifth of their running speed to fatigue. Pro Men bottom quartile is even higher at +25%.
2. Each round costs more than the last. Group the race into 8 rounds (run i + station i) and compare the last round to the first:
| Division | Top: R8/R1 | Bottom: R8/R1 |
|---|---|---|
| Open Men | 1.33× | 2.10× |
| Open Women | 1.25× | 1.89× |
| Pro Men | 1.40× | 2.36× |
| Pro Women | 1.24× | 1.99× |
For the slowest men, the last round is more than double the first. For the fittest, it is up by about a third.
3. The fast actually gain ranks as others tire. For every athlete we computed their percentile within the field at each station, then compared the average percentile over the last four stations against the first four:
| Tier (Open Men) | Percentile drift, late vs early |
|---|---|
| Top 25% | +1.7 pts (moves up) |
| Middle 50% | +0.3 pts |
| Bottom 25% | −3.2 pts (slides down) |
In the women’s race the spread is even wider: top +3.8 pts vs bottom −4.8 pts.
4. Durability is not same as being fit. One can say “durable just means fitter”. But that is not true. We grouped athletes into bands/cohorts of identical fresh running pace (average of Run 1 and Run 2), then split each band into the durable half (low fade) and the fragile half (high fade) and compared median finishes within the band:
| Fresh pace band (Open Men) | Durable half | Fragile half | Durability penalty |
|---|---|---|---|
| ~4:54 /km | 1:29:04 | 1:36:41 | +7:37 |
| ~5:35 /km | 1:43:59 | 1:50:35 | +6:36 |
| ~6:05 /km | 1:51:32 | 2:01:28 | +9:56 |
| ~6:41 /km | 1:59:35 | 2:18:15 | +18:41 |
| ~7:50 /km | 2:19:25 | 2:39:17 | +19:52 |
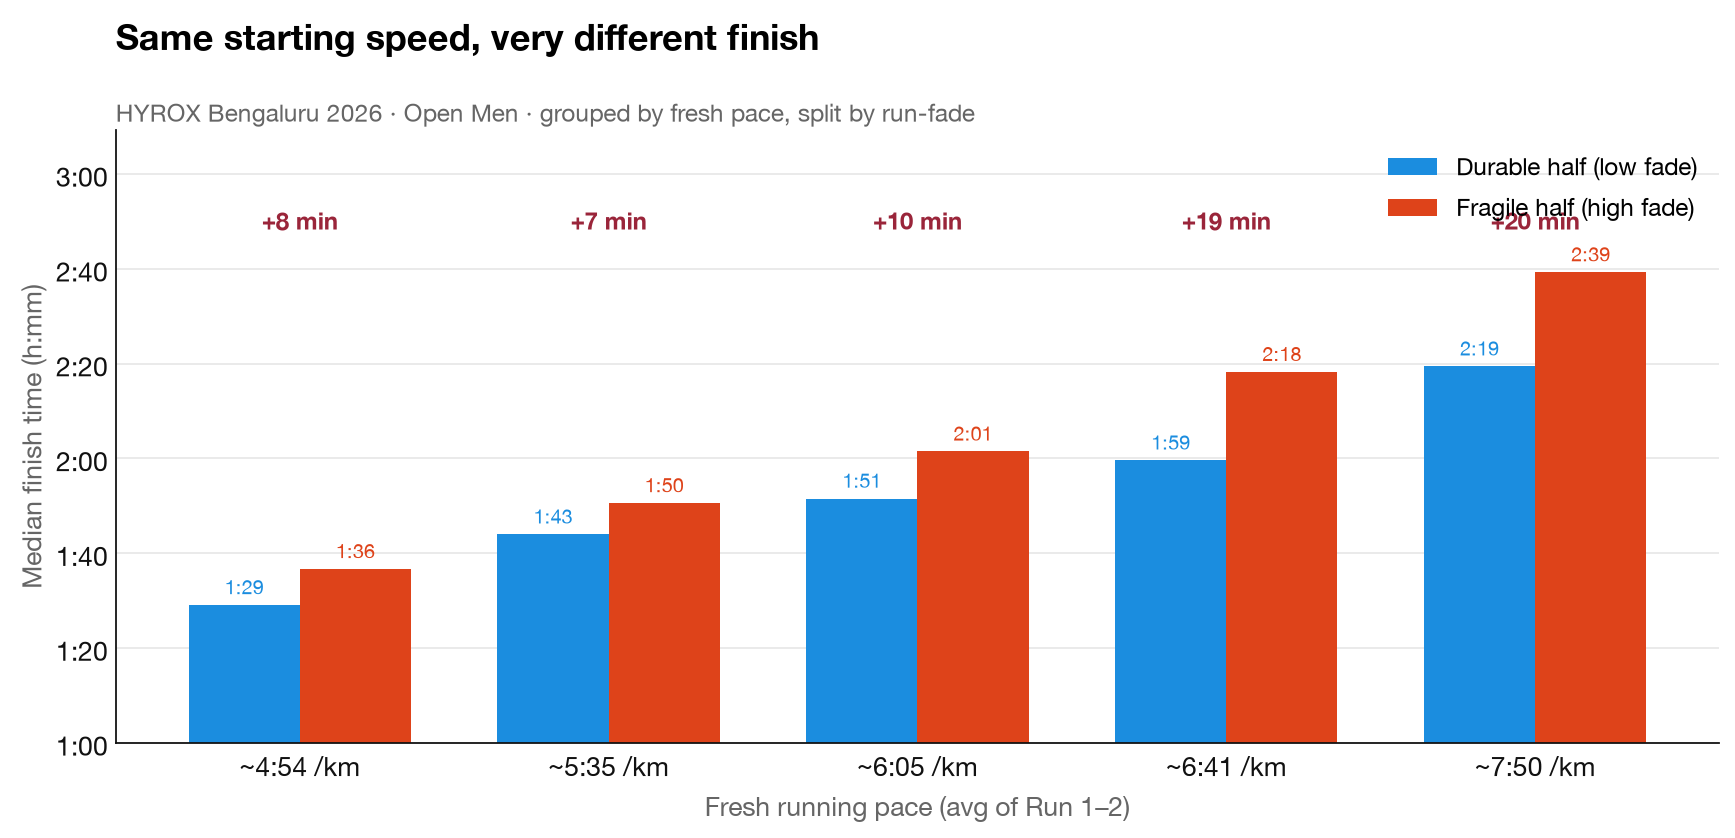
Two athletes who start at the exact same pace can finish 8–20 minutes apart, purely on their ability to handle fatigue resistance. The same pattern holds in every division (Pro Men: up to +25 minutes; Open Women: up to +23). Our take: durability is not a proxy for speed; it is a separately trainable quality, and at the amateur end of HYROX it appears to be the single largest lever you can train on.
Put together: your run pace reveals your level, but your wall balls, your grip, and your ability to keep moving in the second half decide how much time you actually lose.
Our hypothesis on what slows the average HYROX competitor down, in rough order of effect size:
What this suggests for training, for an average amateur with a HYROX time goal:
The consensus among coaches who train HYROX athletes is: your target HYROX run pace should be 15–25% slower than your standalone 5 km race pace. For most amateurs, that lands close to comfortable half-marathon pace — i.e. you spend most of the race running just below your lactate threshold.
To get better at sustaining a pace around your lactate threshold, you do not train only at lactate threshold. You need a healthy weekly mix:
The cleanest way to build all three in the long term is to train for a 10K or a half marathon. Both distances force you into threshold work as a matter of course, and especially the half marathon block teaches your legs to hold a “comfortable hard” pace for over an hour — exactly what HYROX demands of the runs between stations.
RunStrong
If you want a structured way to do this, RunStrong has personalized 10K and half marathon plans that adapt to your schedule and current fitness.
Have you have liked these insights? If you have found any additional patterns in the data, we would love to hear from you. Please share with us via email or through any of our social media channels.

