

A warmer race day can change your finish time even when your fitness, pacing and preparation remain the same. But by how much?

A warmer race day can change your finish time even when your fitness, pacing and preparation remain the same. But by how much?
Most race calculators rely on studies from cities such as Berlin, Boston and Chicago. Those estimates are useful, but Indian races bring a different mix of heat, humidity and rapidly warming mornings. We wanted to know what the heat tax looks like for runners racing in India.
The answer comes from mytimes.run, an open and searchable index of Indian road-race results.
To the best of our knowledge, this is the first published analysis of race-day heat built entirely on real Indian road-race data — 4.2 million finishes across 3,628 events and 141,388 runners, with nearly 200,000 same-runner heat comparisons drawn from that pool. It gives us a distinctly Indian estimate of what heat actually costs on race day.
Because results belonging to the same runner are linked across races, we could compare runners with themselves. We found 199,285 occasions on which a runner completed the same distance on a cooler morning and a warmer one.
Look up your own races
mytimes.run is a free, open index of Indian road-race results. You can search any race or runner, and create your own profile to link every finish you have run across the country in one place — the same linking that made this analysis possible.
Comparing one runner with another would tell us very little. Their fitness, age, training and racing ability could all differ. Instead, we asked a simpler question:
When the same runner races the same distance on a morning that is 5°C hotter on the combined heat measure, how much slower do they run?
Across nearly 200,000 comparisons, a clear pattern emerged. The effect was almost zero over 5K, noticeable over 10K and substantially larger over the half marathon and marathon.
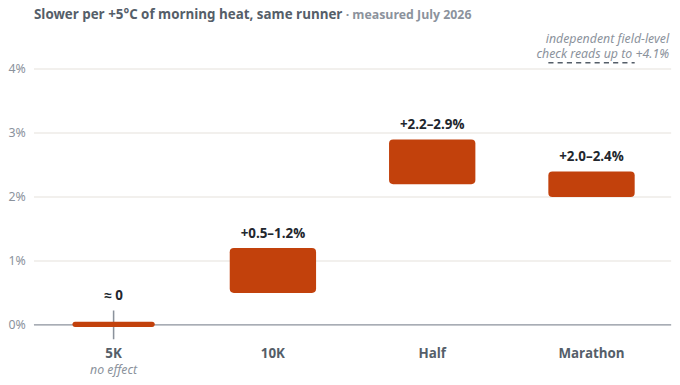
| Distance | Any two races | Same race in different years |
|---|---|---|
| 5K | No measurable change | Not enough data |
| 10K | 1.22% slower | 0.50% slower |
| Half marathon | 2.90% slower | 2.22% slower |
| Marathon | 2.01% slower | 2.36% slower |
The exact estimate changes depending on how tightly we control for the course and event. The important finding is the direction and shape of the result: the longer the distance, the more the warm morning costs.
Percentages are useful for analysis, but runners think in finish times.
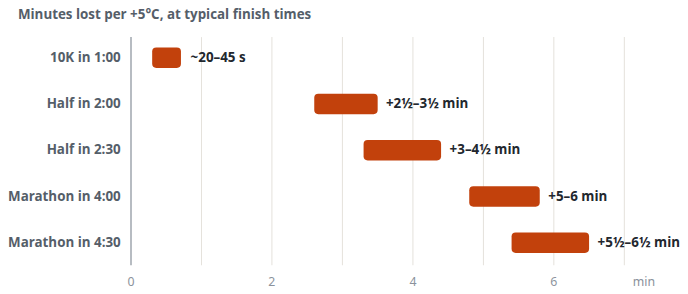
A 5°C rise in effective heat could cost a two-hour half marathoner roughly three minutes. For a 4:30 marathoner, the weather alone could add around six minutes, even before poor pacing, dehydration or cramping enter the picture.
That distinction matters. Losing three minutes because the morning is warmer is not a failed race. Refusing to adjust for those three minutes, then losing much more in the final kilometres, is the real risk.
Model your own race
Heat is not the only variable that bends your finish time — altitude and course grade do too. RunStrong’s race finish time calculator does the math for all three, so you can enter your baseline finish time and see what a specific Indian race morning is likely to cost you. Our companion piece Every 42.2K is Different. Here’s Why walks through the model behind it.
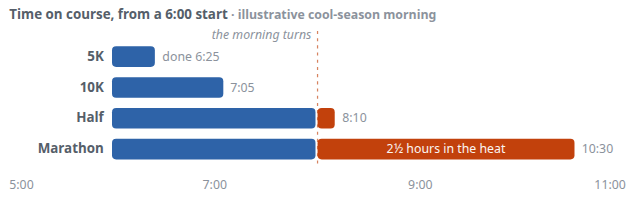
Exposure is the simplest explanation.
A 25-minute 5K may be over before the morning warms significantly. A half marathoner stays on the road beyond sunrise. A marathoner can spend several hours running as the temperature and solar load continue to rise.
The body must also manage the heat it produces while running. As the environment becomes warmer and more humid, shedding that heat becomes harder. More blood is directed towards the skin for cooling, sweat losses rise and sustaining the same pace becomes progressively more expensive.
The near-zero result at 5K is therefore important. If poor weather matching or errors in linking runners were driving the analysis, we might expect similar distortion at every distance. Instead, the effect increases as exposure increases, which is what we would expect physiologically.
Comparing a runner with themselves removes much of the difference in ability, but it does not automatically remove the effects of course, city, season or event organisation. We therefore tested the relationship in three ways.
Each method has different weaknesses, but all three pointed in the same direction at every distance. That consistency gives us more confidence than any single estimate on its own.
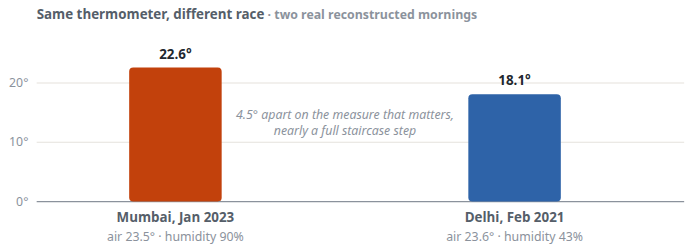
Runners often look only at the temperature in the weather app. That misses a crucial part of the heat equation: humidity.
Sweating cools the body only when the sweat evaporates. When humidity is high, evaporation slows and the same air temperature becomes much harder to race in.
Consider two historical race mornings:
The thermometer readings were almost identical, but the effective heat differed by about 4.5°C. That is nearly the full step used in this analysis.
All the estimates in this article refer to a 5°C increase in a combined, wet-bulb-based heat measure, not simply a 5°C increase in air temperature.
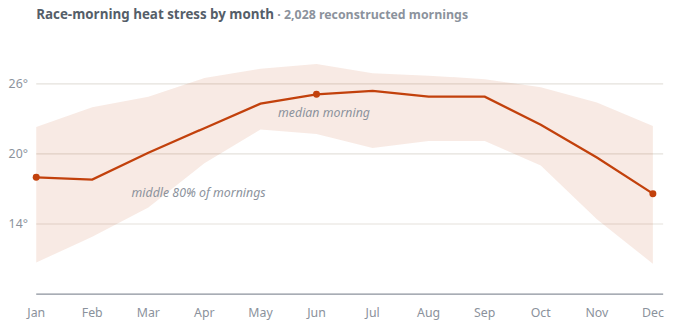
Across roughly 2,000 reconstructed race mornings in India, the monthly pattern also explains why so much road racing is concentrated between October and March. Even within those months, however, race-day conditions can vary widely.
Previous marathon research has suggested that runners farther back in the field may lose far more time in warm conditions than faster runners. Our results were different.
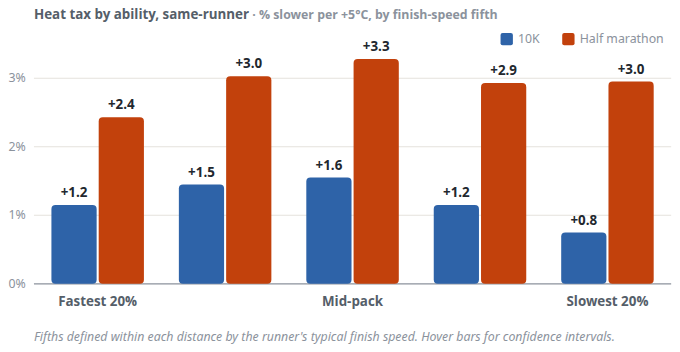
We divided 10K and half-marathon runners into five groups based on ability. The marathon sample was too small to split reliably. The heat penalty did not keep increasing towards the back of the field. It was highest in the middle.
At 10K, the slowest group lost about 0.75%, compared with roughly 1.55% for the middle group. At the half marathon, runners at the back lost about as much as the middle group, not three times as much.
One possible explanation is that faster runners operate closer to their limit but finish sooner. Slower runners remain exposed for longer but may run farther below their physiological ceiling and take walk breaks that provide some relief. Mid-pack runners can face both high relative effort and prolonged exposure.
That explanation remains a hypothesis. The observed mid-pack pattern is stronger than our certainty about its cause. It was also driven mainly by the men’s data; the women’s curve was flatter and based on a smaller sample.
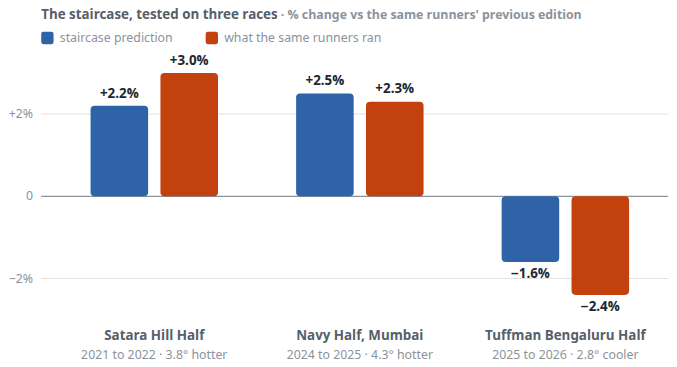
We tested the estimate against three half marathons run on stable courses across two different years. In each case, a meaningful number of runners returned to the same event in different conditions.
The predicted change and the actual change among returning runners moved in the same direction and were of a broadly similar size. The comparison also captured time gained back when Bengaluru had the cooler race morning.
These event-level checks do not prove that the model will predict every race precisely. They do show that the larger pattern appears in real races, not just in the combined dataset.
You can explore individual races and compare editions at mytimes.run/research/heat.
Look at the forecast for the full race window, not only the starting temperature. A humid 24°C can be a very hot racing morning. A dry 24°C may be considerably more manageable.
If the effective heat is around 5°C higher than the conditions on which your goal was based, a reasonable starting adjustment is:
These are population-level estimates, not exact personal predictions. Your heat acclimatisation, sweat rate, pacing, hydration and course exposure will change the outcome.
The largest penalty in this dataset appeared in the middle of the field. If you expect to race hard for a prolonged period, take the adjustment seriously even if you do not consider yourself particularly slow.
Starting faster to compensate for an expected slowdown usually makes the heat problem worse. The tax is collected late, after the morning has warmed and your body has accumulated more heat. An evenly paced race with an adjusted goal is safer than trying to build a cushion in the opening kilometres.
Weather conditions were reconstructed using modelled estimates. They cannot fully capture direct sun, shade, wind or how exposed a particular course may be. A sunny, open road can therefore feel harder than the numbers suggest.
Season is another complication. Warm and cool races may occur at different points in a runner’s training year. When the calendar month was held constant, the estimates became smaller, approximately 0.6% for the 10K and 1% for the half marathon. The penalty also appeared to increase more sharply once the morning was already hot.
There are further limitations, including which finishers could be linked across races and the fact that runners who did not finish are absent from the finish-time data. The detailed methodology is available on mytimes.run.
The estimates should therefore be treated as a planning guide, not a universal conversion table. But the main conclusion is difficult to ignore: on a warmer Indian race morning, holding the same pace requires more effort, and the cost grows as the race gets longer.
Adjusting your target is not giving up before the start. It is responding intelligently to the course conditions you actually have.

